
Dividend Portfolio Overview
ポートフォリオ MaxDividends
当座預金
351 983,38 USD
総収入
+4 027,70 USD (+1,03%)
定期収入
1 036.06 USD

12 432.70 USD

+3.53%
12 945.96 USD

ポートフォリオについて
ポートフォリオのリターン
最高の取引
選別
Your strategy’s breakdown by sectors, industries, and assets - this shows how you’re spreading your bets across the market.セクター
産業
資産
ポートフォリオ構造
Вот полная картина того, как работают ваши деньги — каждый актив в вашей стратегии, а также вес каждого из них.Total Strategy Value
Top Holdings (by % of Strategy)
時価総額別の資産分布
ビッグドッグ。これらは100億ドル以上の巨大企業です。
これらは堅実で確立された企業で、通常20億ドルから100億ドルの時価総額です。嵐にも耐えられるほどの規模でありながら、成長の余地も残しています。
中規模企業。時価総額は3億ドルから20億ドルです。成長はしていますが、やや不安定な場合があります。
セクターごとに分類された資産
Here’s where your money’s working across different industries. A good mix of sectors helps smooth out risk - some pay steady dividends, others offer growth potential.大量の保有物 製品
-
Intel (MMM)23.03%
-
Texas instrumental (AMAT)7.11%
-
Tractor supply (CMI)8.25%
-
Pool (POOL)3.03%
-
ZM company (ROCK)5.24%
アセットの配置
Here’s the breakdown of what you own私の資産
Лучшие позиции в вашей стратегии
大規模な資産:資産タイプ
会社
TXN
Texas Instruments IncorporatedSNA
Snap-on IncorporatedTSCO
Tractor Supply CoPOOL
Pool CorporationHRL
Hormel Foods CorporationGPC
Genuine Parts CompanyMDT
Medtronic plcADM
Archer Daniels Midland CompanyCSCO
Cisco Systems, IncPEP
PepsiCo, IncTROW
T. Rowe Price Group, IncJNJ
Johnson & JohnsonRHI
Robert Half International IncUPS
United Parcel Service, IncLOW
Lowe's Companies, IncTGT
Target CorporationUVV
Universal CorporationCVX
Chevron CorporationPII
Polaris IncOZK
Bank OZKBBY
Best Buy Co., IncGIS
General Mills, IncFDX
FedEx CorporationNXST
Nexstar Media Group, IncLEN
Lennar CorporationHSY
The Hershey CompanyZTS
Zoetis IncVRTS
Virtus Investment Partners IncNVO
Novo Nordisk A/SSCVL
Shoe Carnival IncGEF-B
Greif IncCIX
CompX International IncPRI
Primerica IncMLI
Mueller Industries IncADP
Automatic Data Processing, IncBAH
Booz Allen Hamilton Holding Corporation利益率
営業利益率ttm
ROA ttm
ROE ttm
収益/シェア ttm
企業価値/EBITDA
Inspired by this portfolio?
Try MaxDividends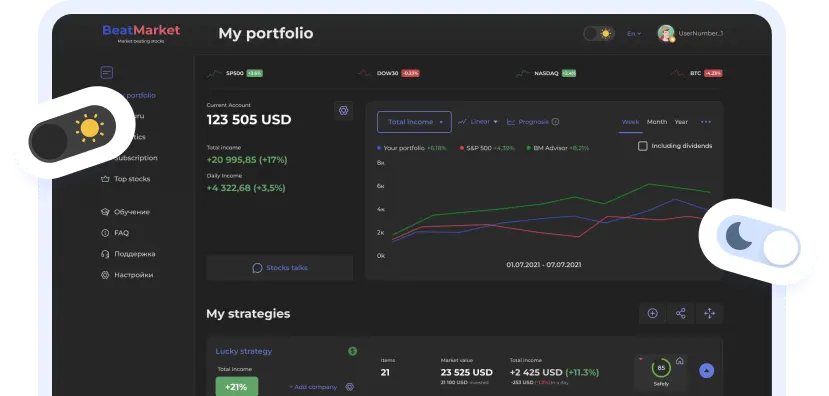






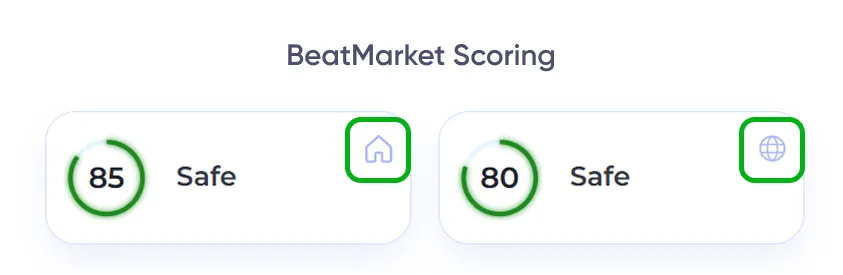

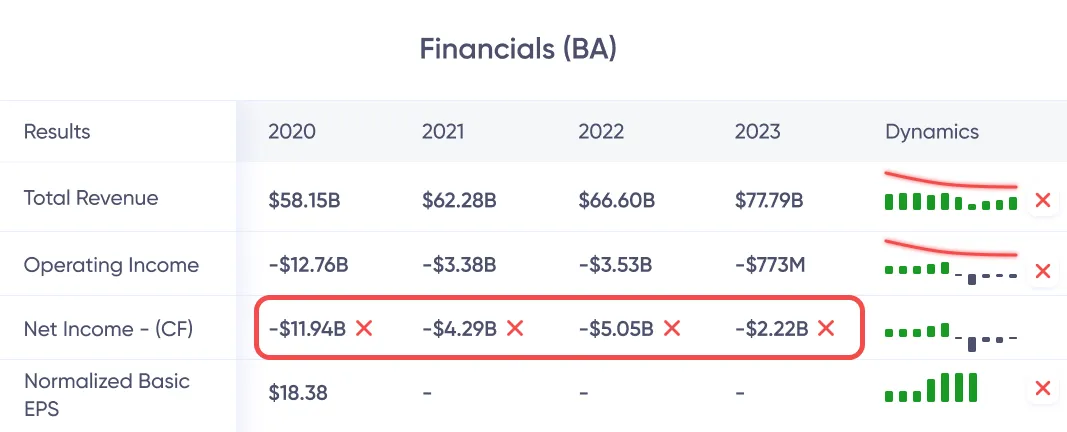


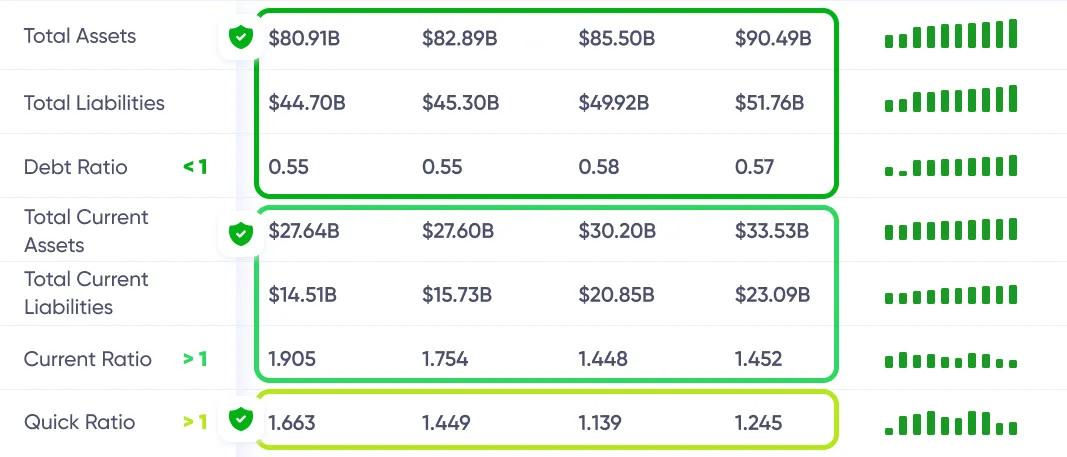
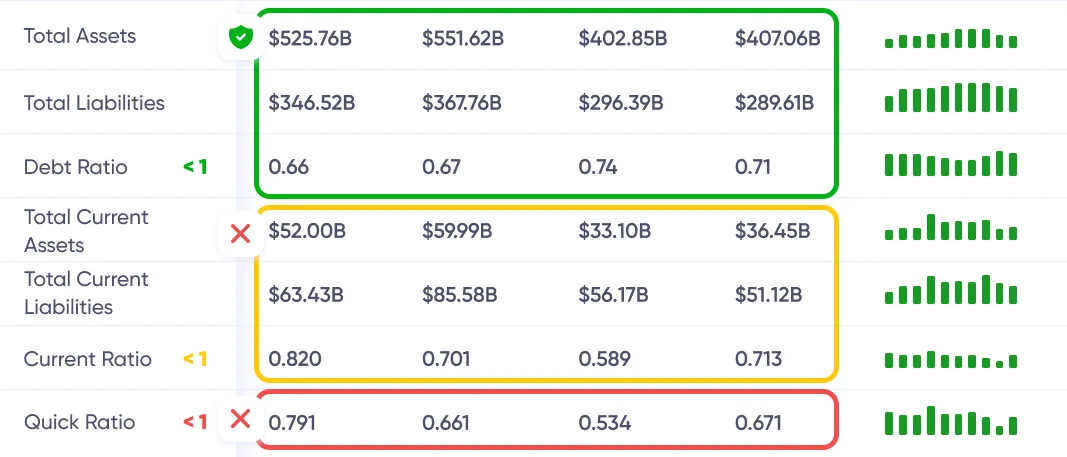

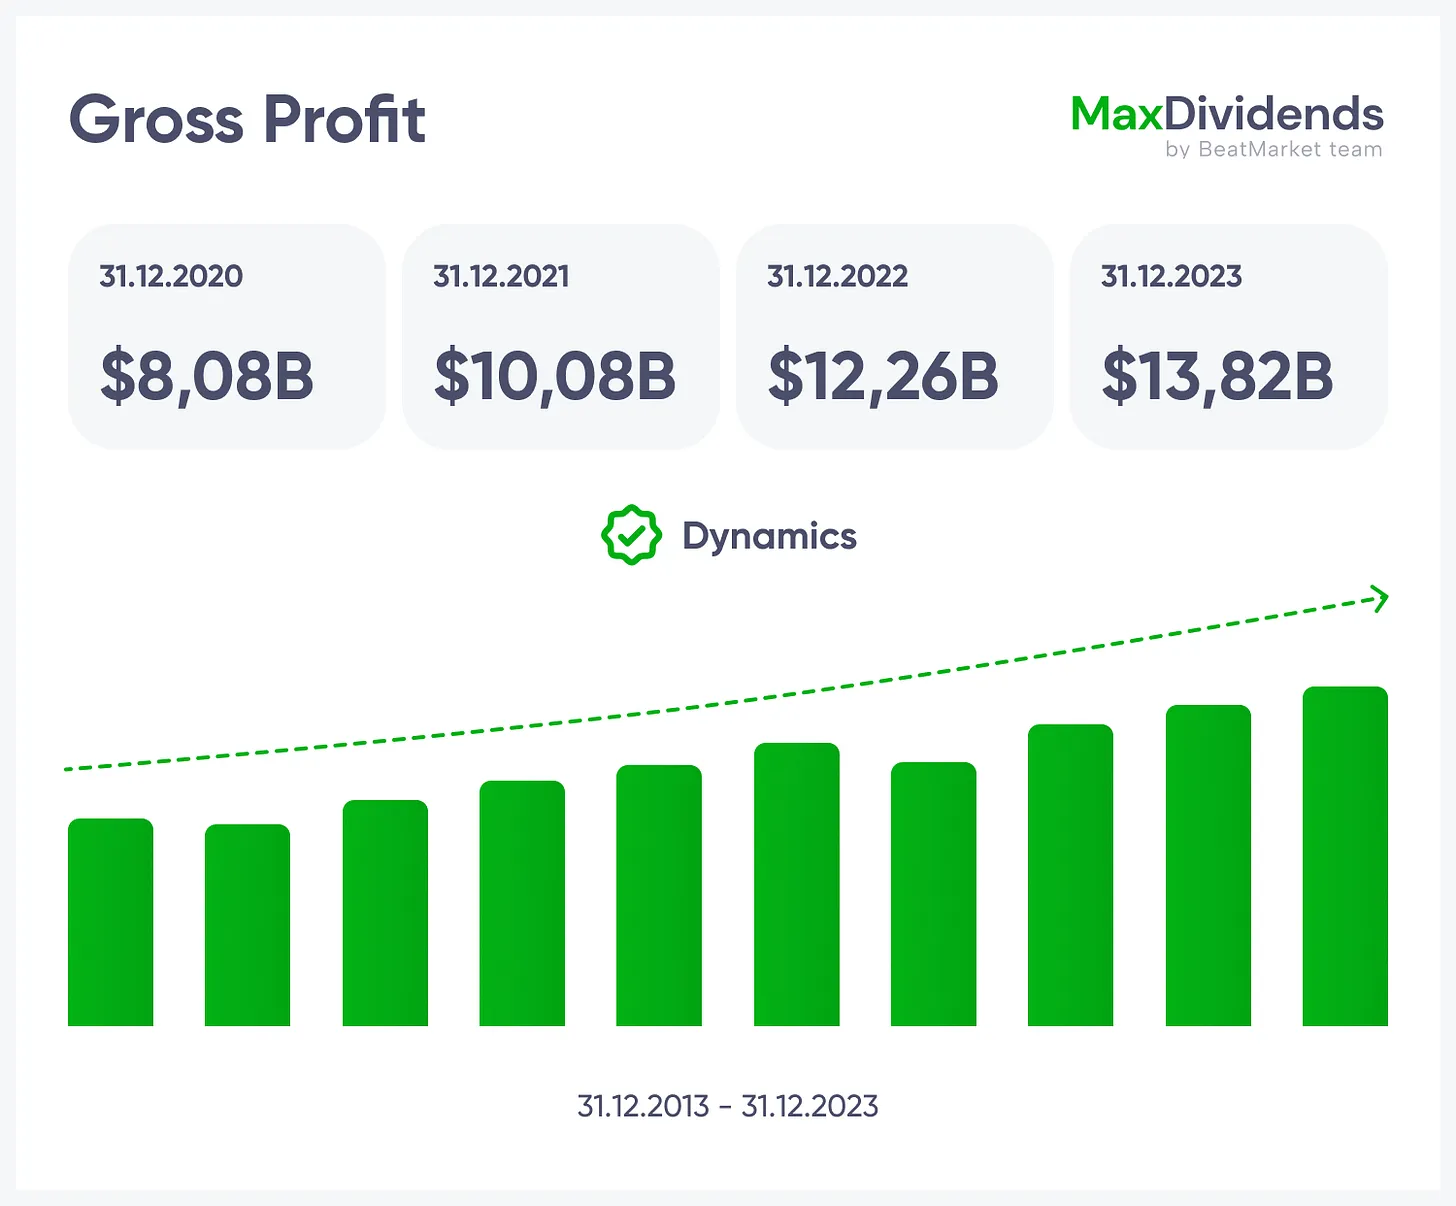
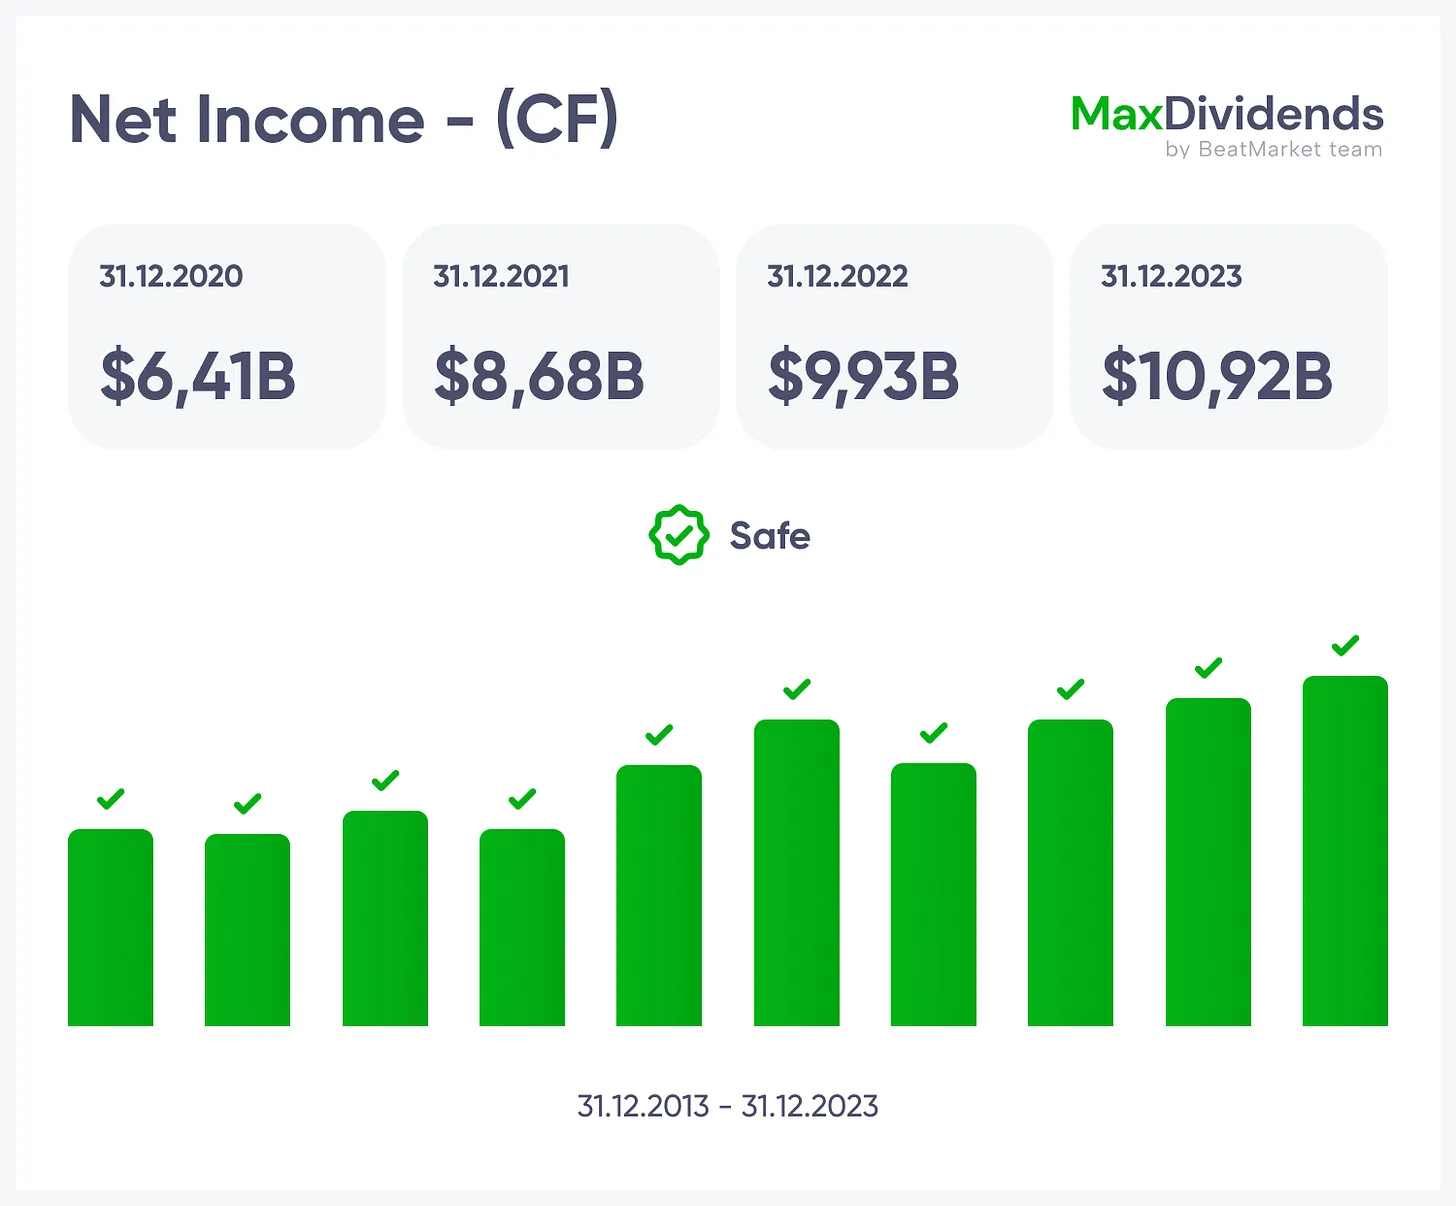
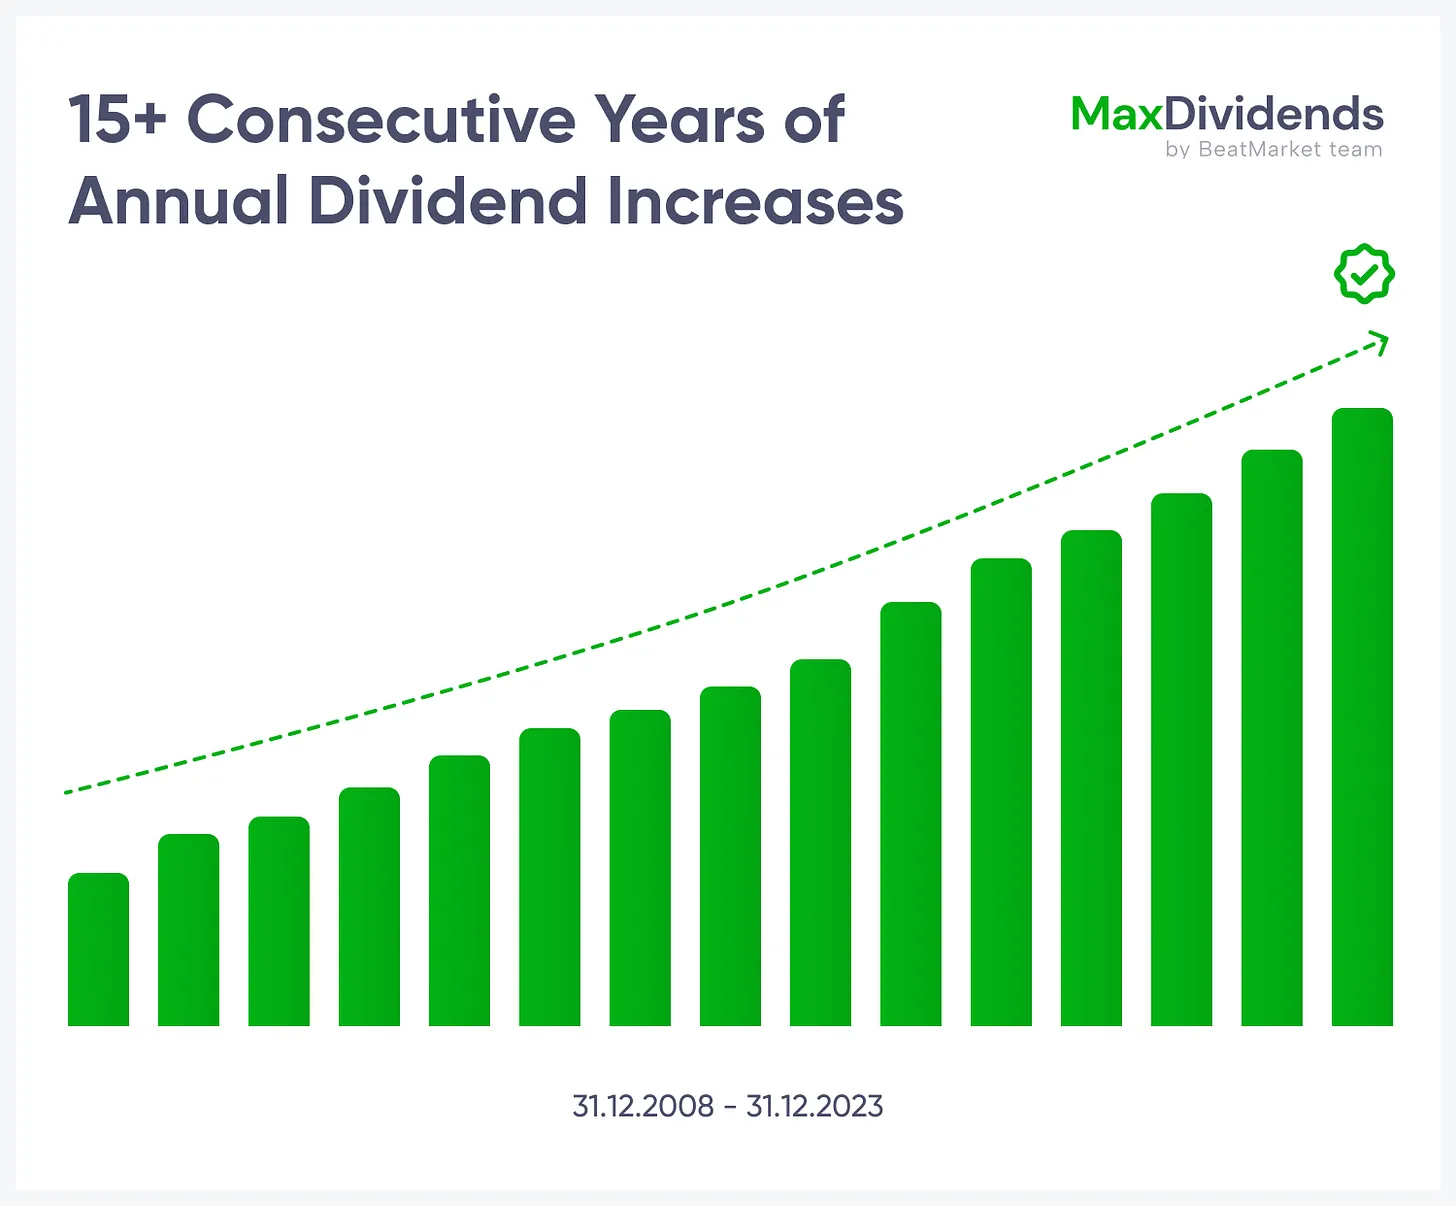
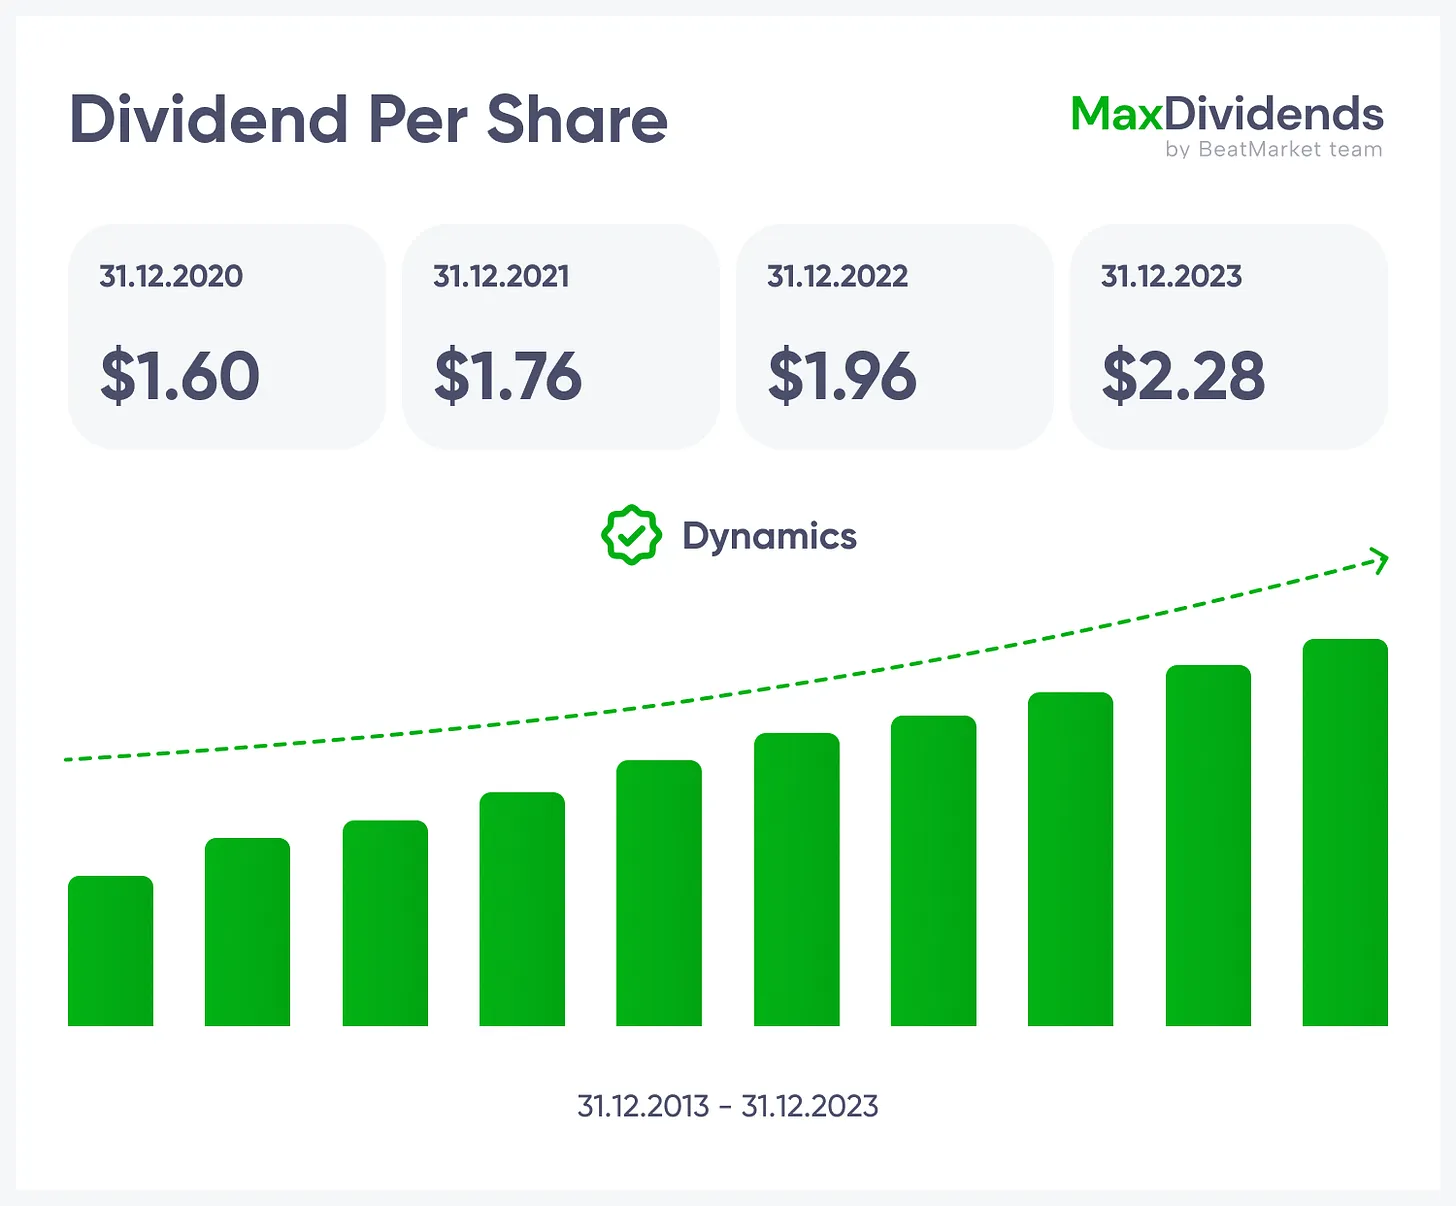
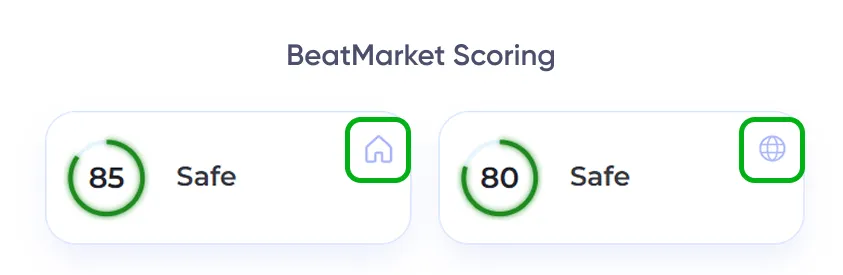
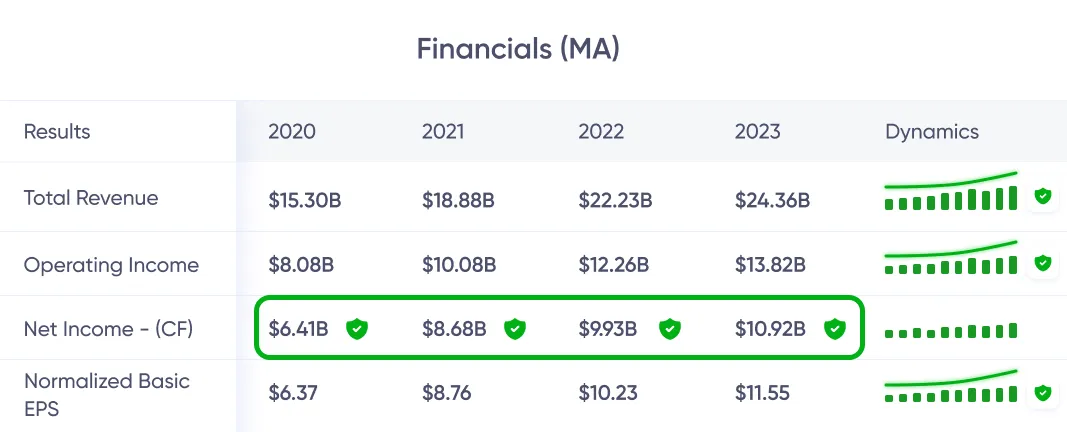
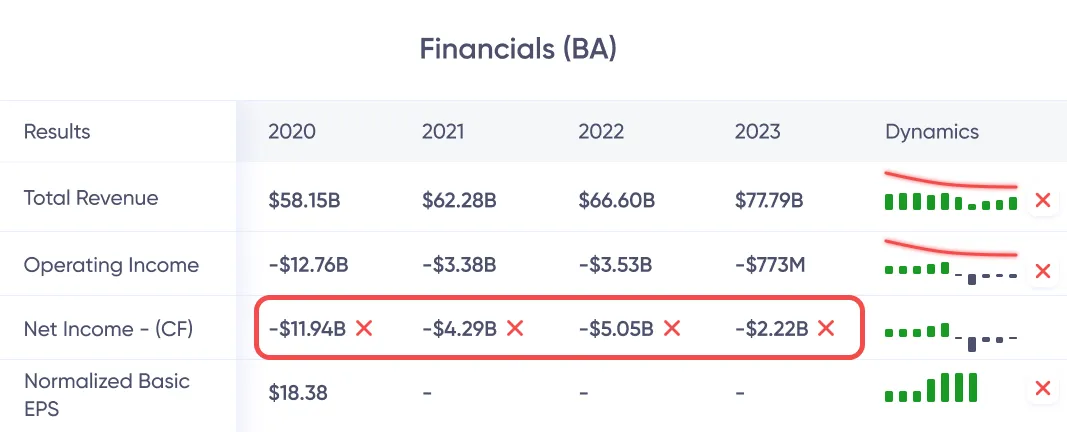



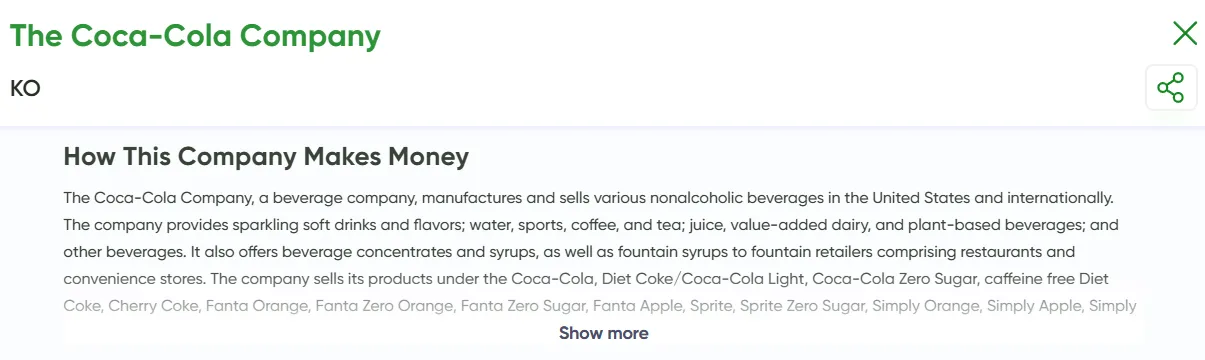 ビジネス全体を一目で見る — 何をし、どのように収益を上げ、どのような価値をもたらすか。

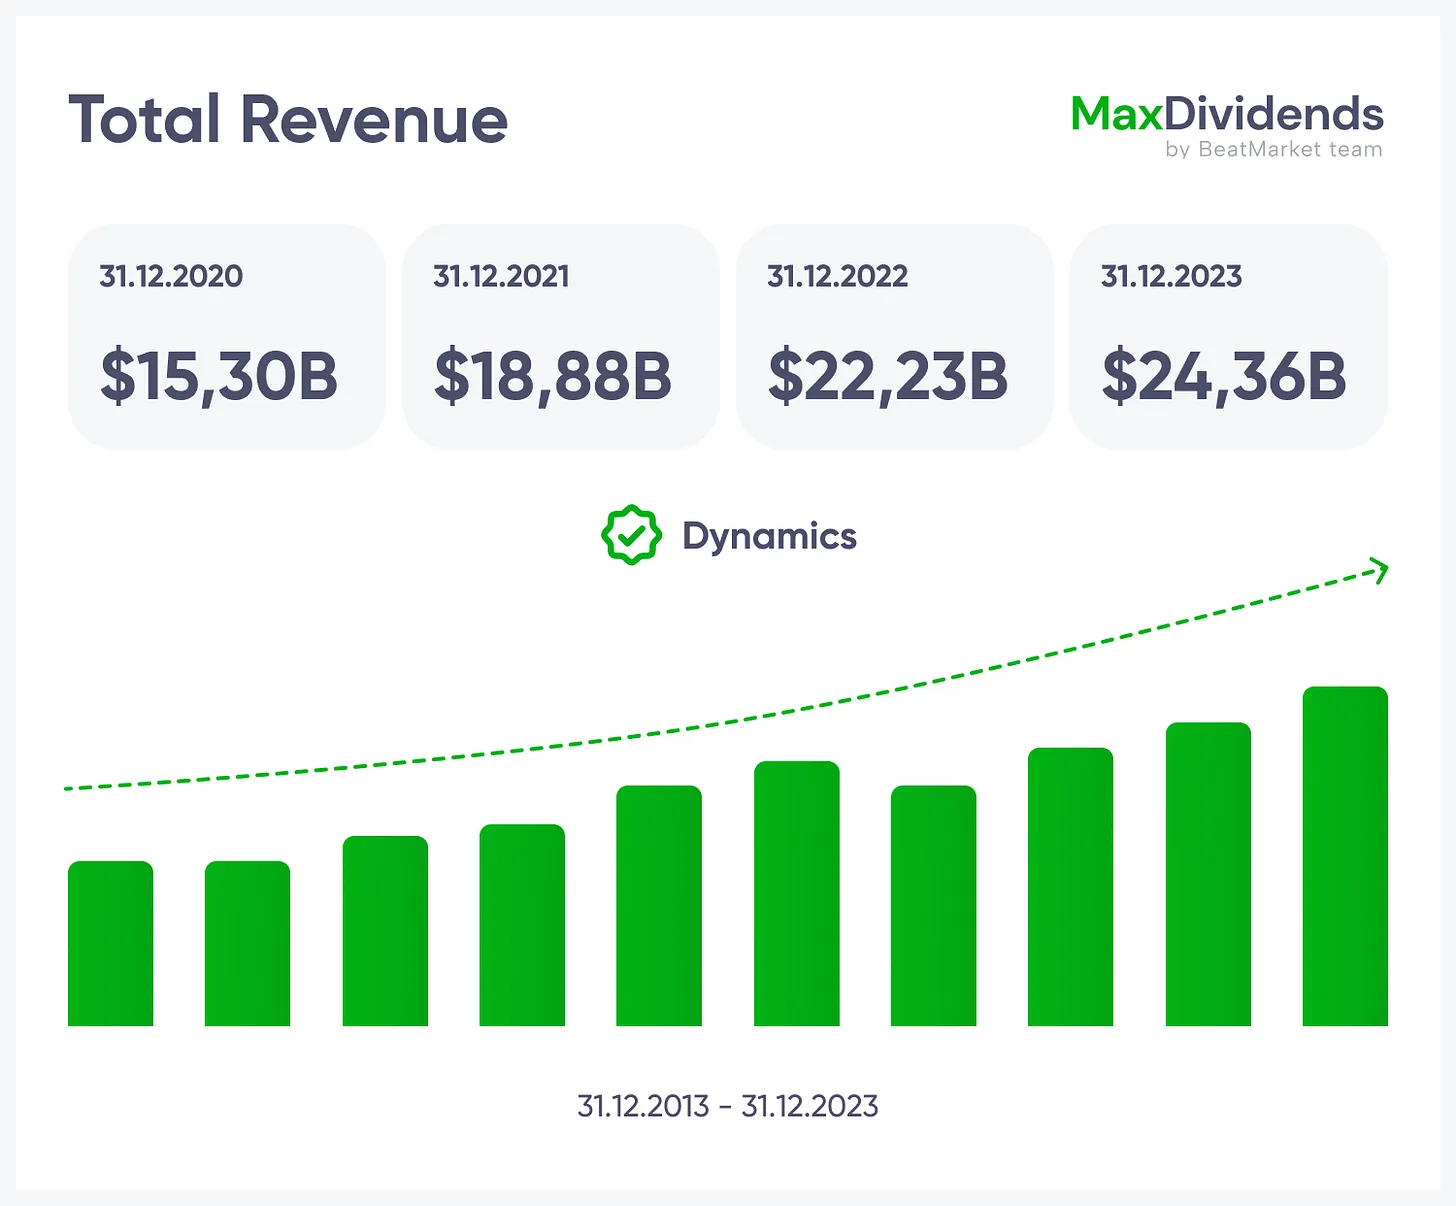
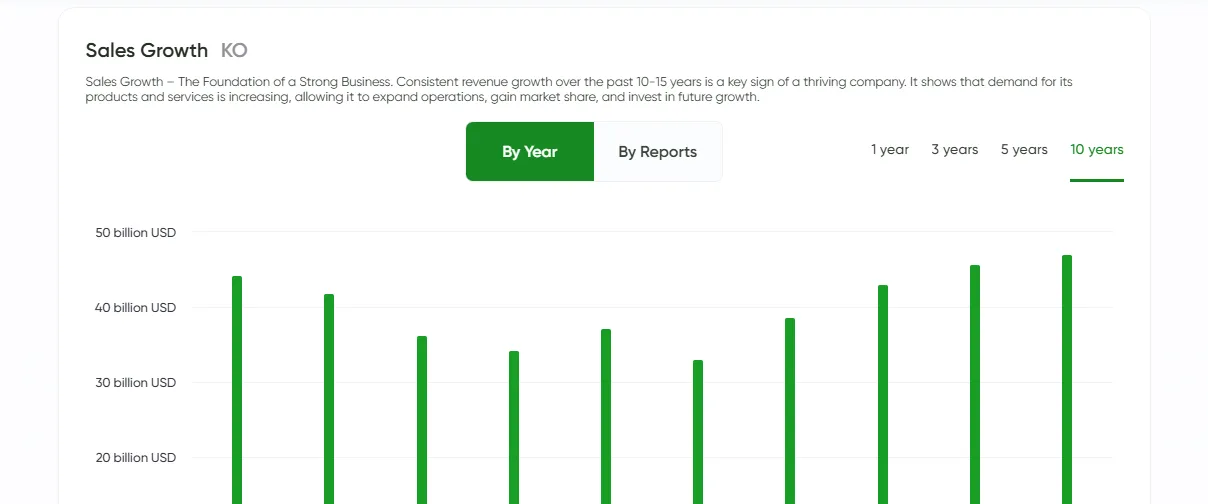 成長傾向、ひと目で明確。
 利益が本物か — 即座に確認。
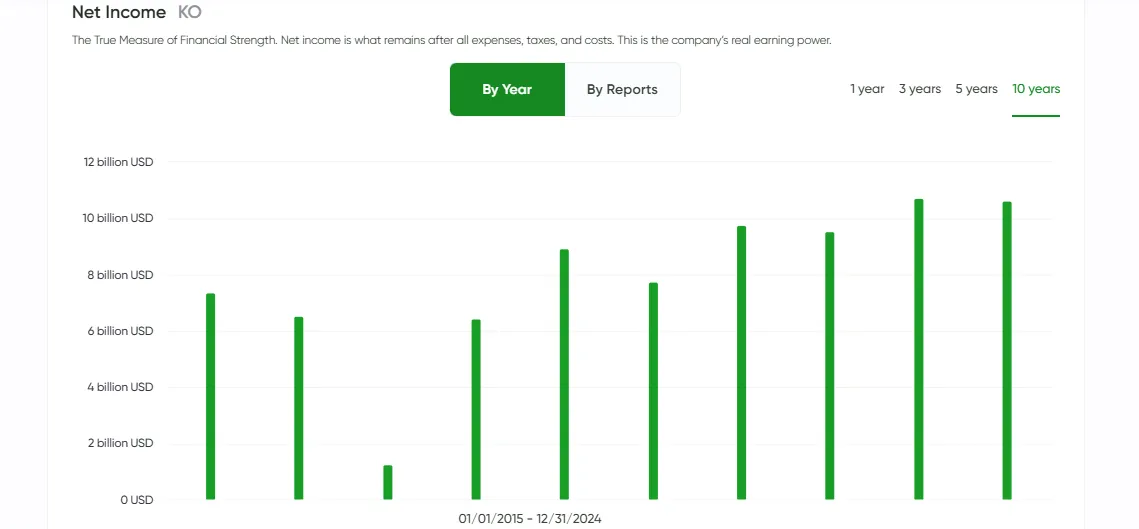 MaxDividendsでシンプルになった最終利益。
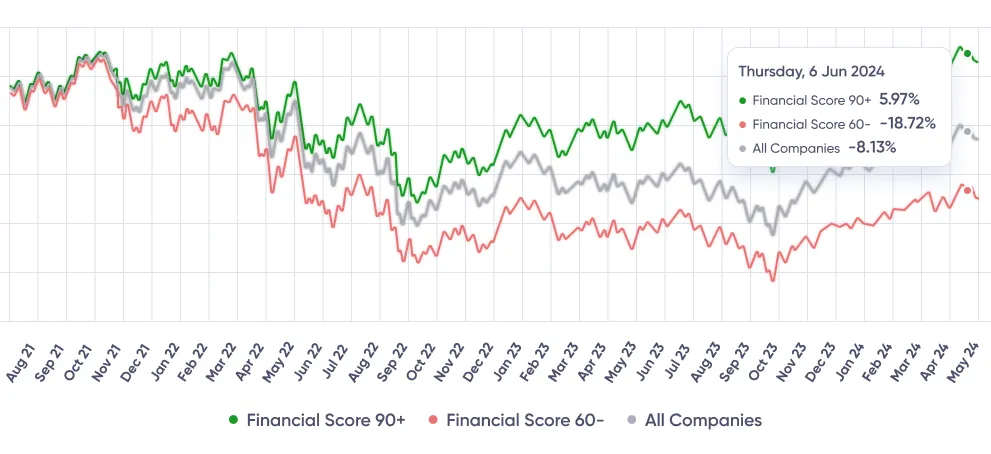
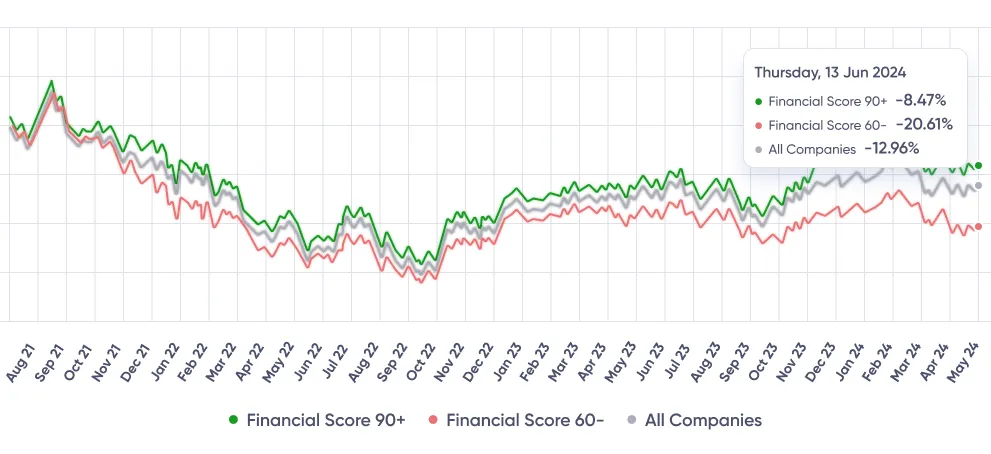
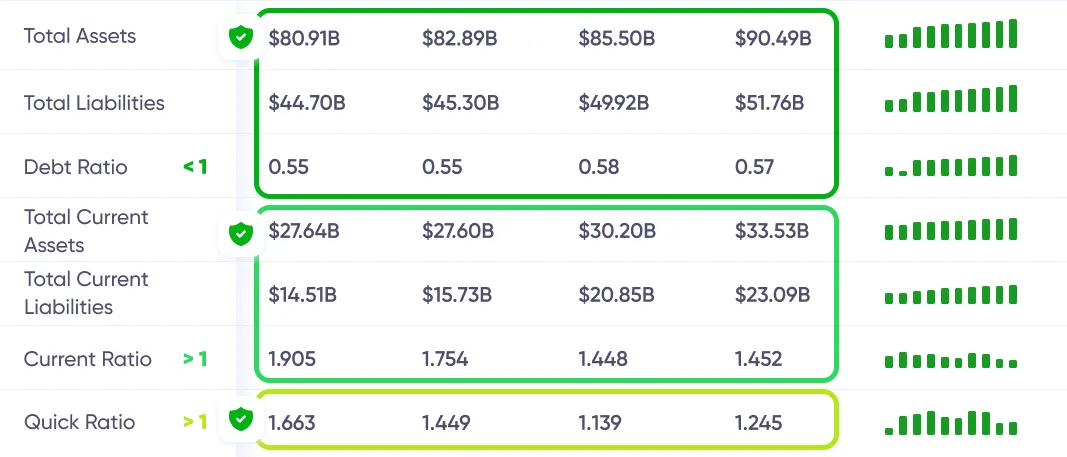
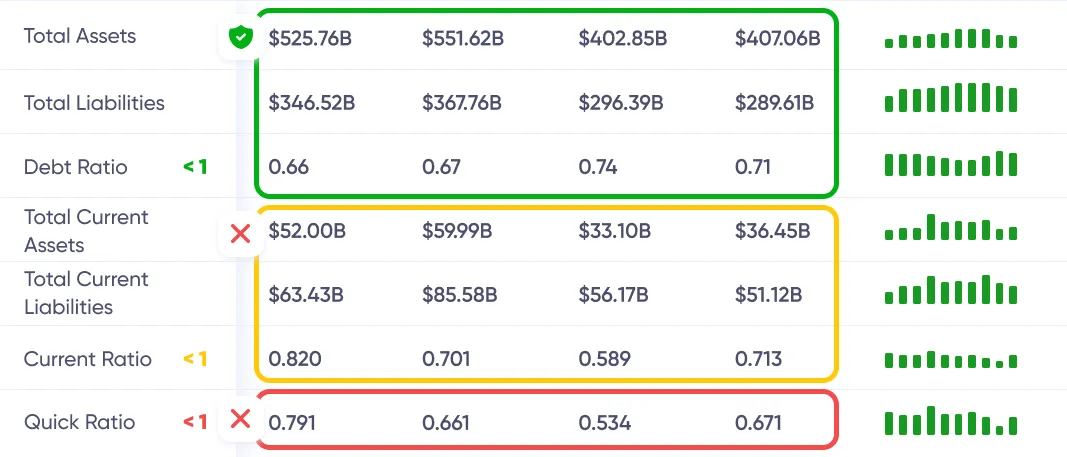
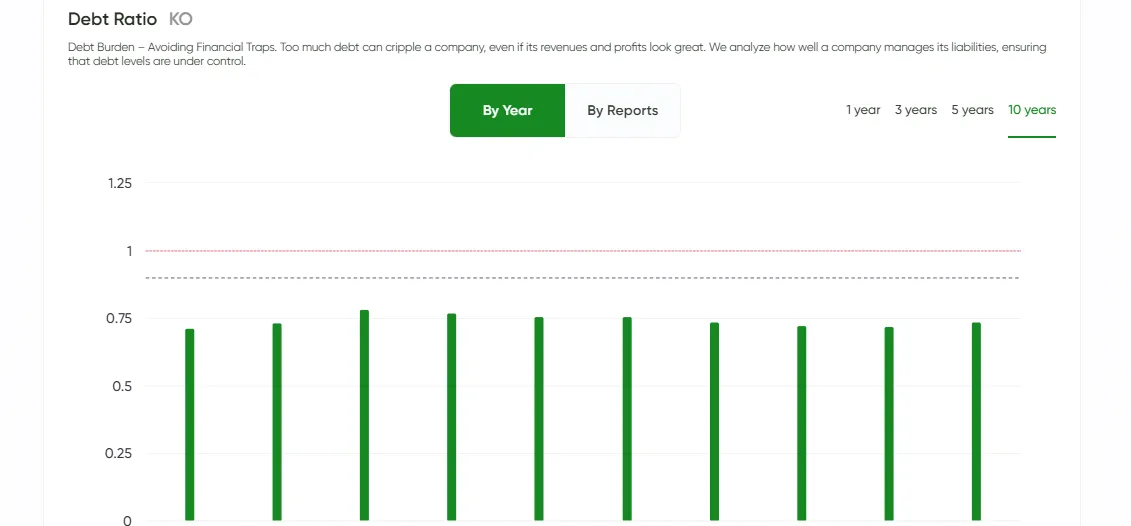 負債リスクを24時間365日チェック。
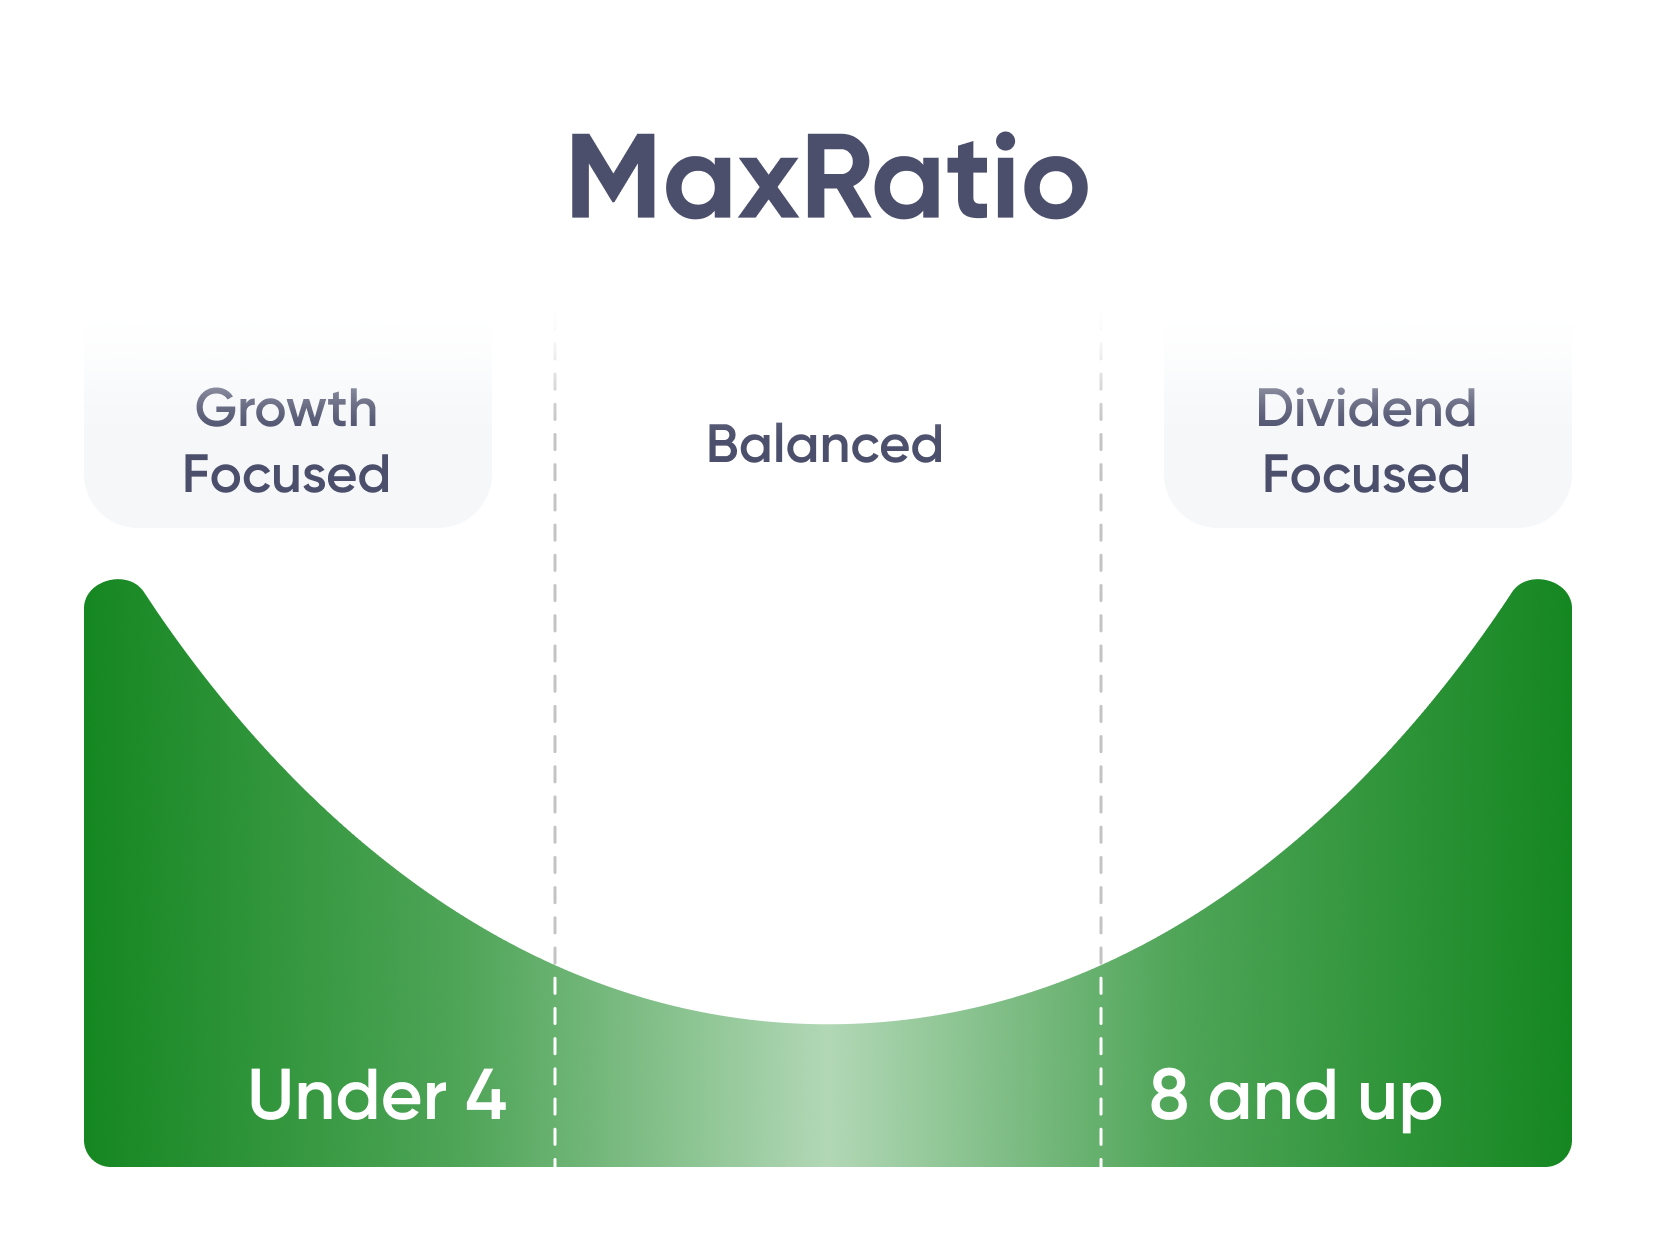
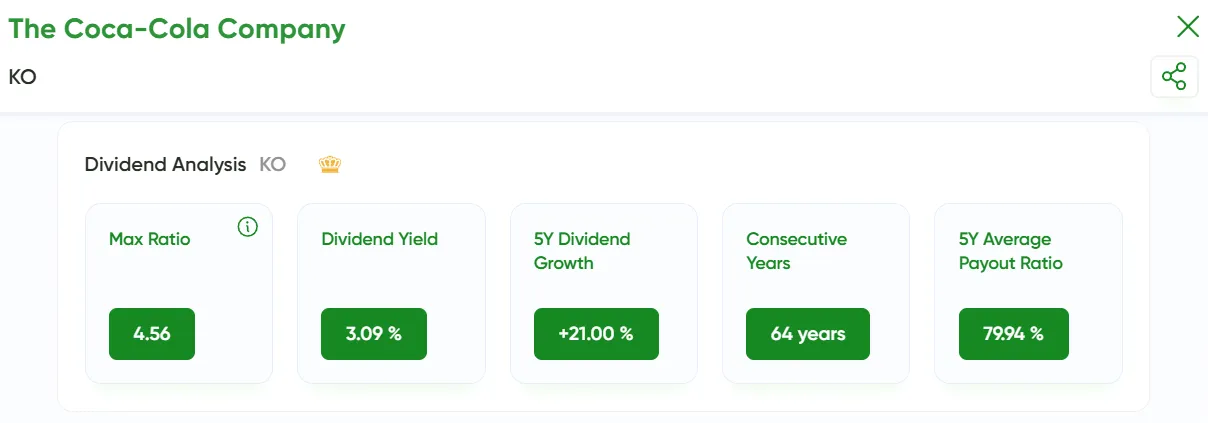
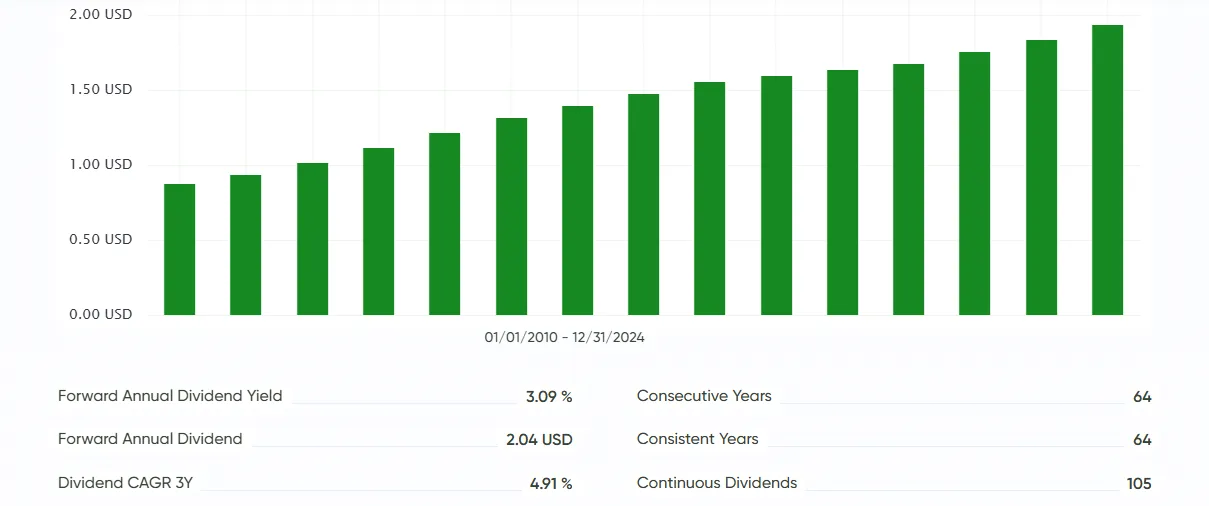
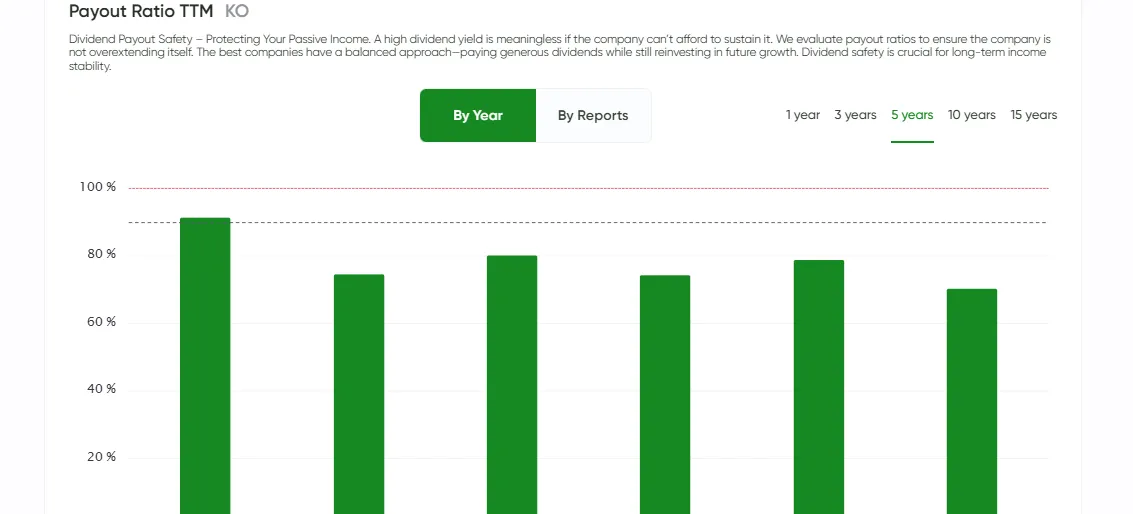 配当の継続年数と増額が指先に。
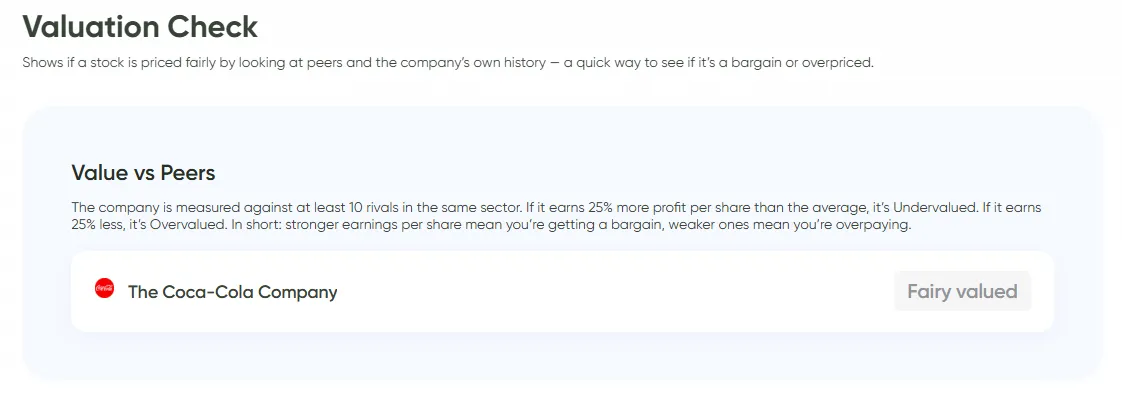 Stack the company against rivals. If it earns more per share, it's undervalued. If less, overpriced.
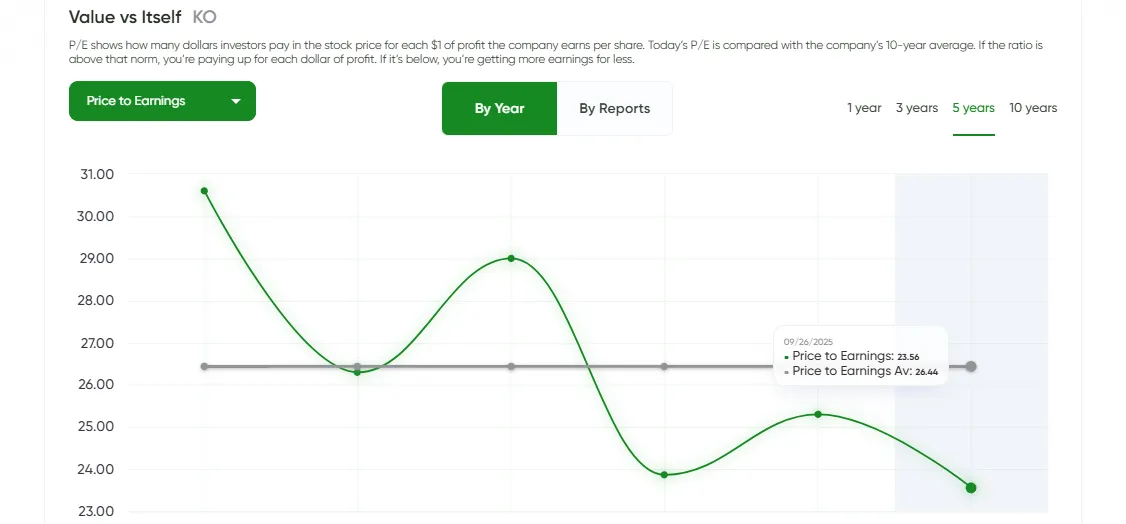 Compare today's P/E with its own 10-year history. Above average = expensive. Below = bargain.
 See if the stock trades below its assets. That's buying the business with built-in margin of safety.

 BeatStart