
Dividends
Portfolio UK Model Dividend Portfolio
Current Balance
12 649,99 GBP
Capital Gains
+951,22 GBP (+8,13 %)
Dividend Income
40.09 GBP

481.05 GBP

+2.90%
363.44 GBP

Annual Dividends
Average Monthly
29.94 GBPAverage Daily
0.98 GBPTop 3 Payers
MPE
80.4 GBP (+22.38%)III
76.05 GBP (+21.17%)LTHM
36.7 GBP (+10.21%)Other
166.17 GBP (+46.25%)Dividend Yield (FWD)
Dividend Yield On Cost
+ 2.90 %Dividend Yield (TTM)
+ 2.68 %10-Year Annual Dividend Growth
5-Year Annual Dividend Growth
+ 12.35 %YTD Dividend Growth
+ 15.81 %Monthly Income
Aug 2026 - Jul 2027
Payout Calendar
Ticker
AHT
ASY
BA
BMY
BNZL
BPM
BRK
CWK
DOM
DWHA
HIK
HILS
III
LSEG
LTHM
MACF
MGNS
MPE
NWF
REL
RS1
SAFE
TEP
TET
VSVS
Jan 2026
Feb 2026
Mar 2026
Apr 2026
May 2026
Jun 2026
Jul 2026
Aug 2026
Sep 2026
Oct 2026
Nov 2026
Dec 2026
Jan 2027
Feb 2027
Dividend Growth by Industries TTM
Industrials
Basic Materials
Consumer Defensive
Real Estate
Financial Services
Healthcare
Consumer Cyclical
Technology
Energy
Communication Services
Inspired by this portfolio?
Try MaxDividends












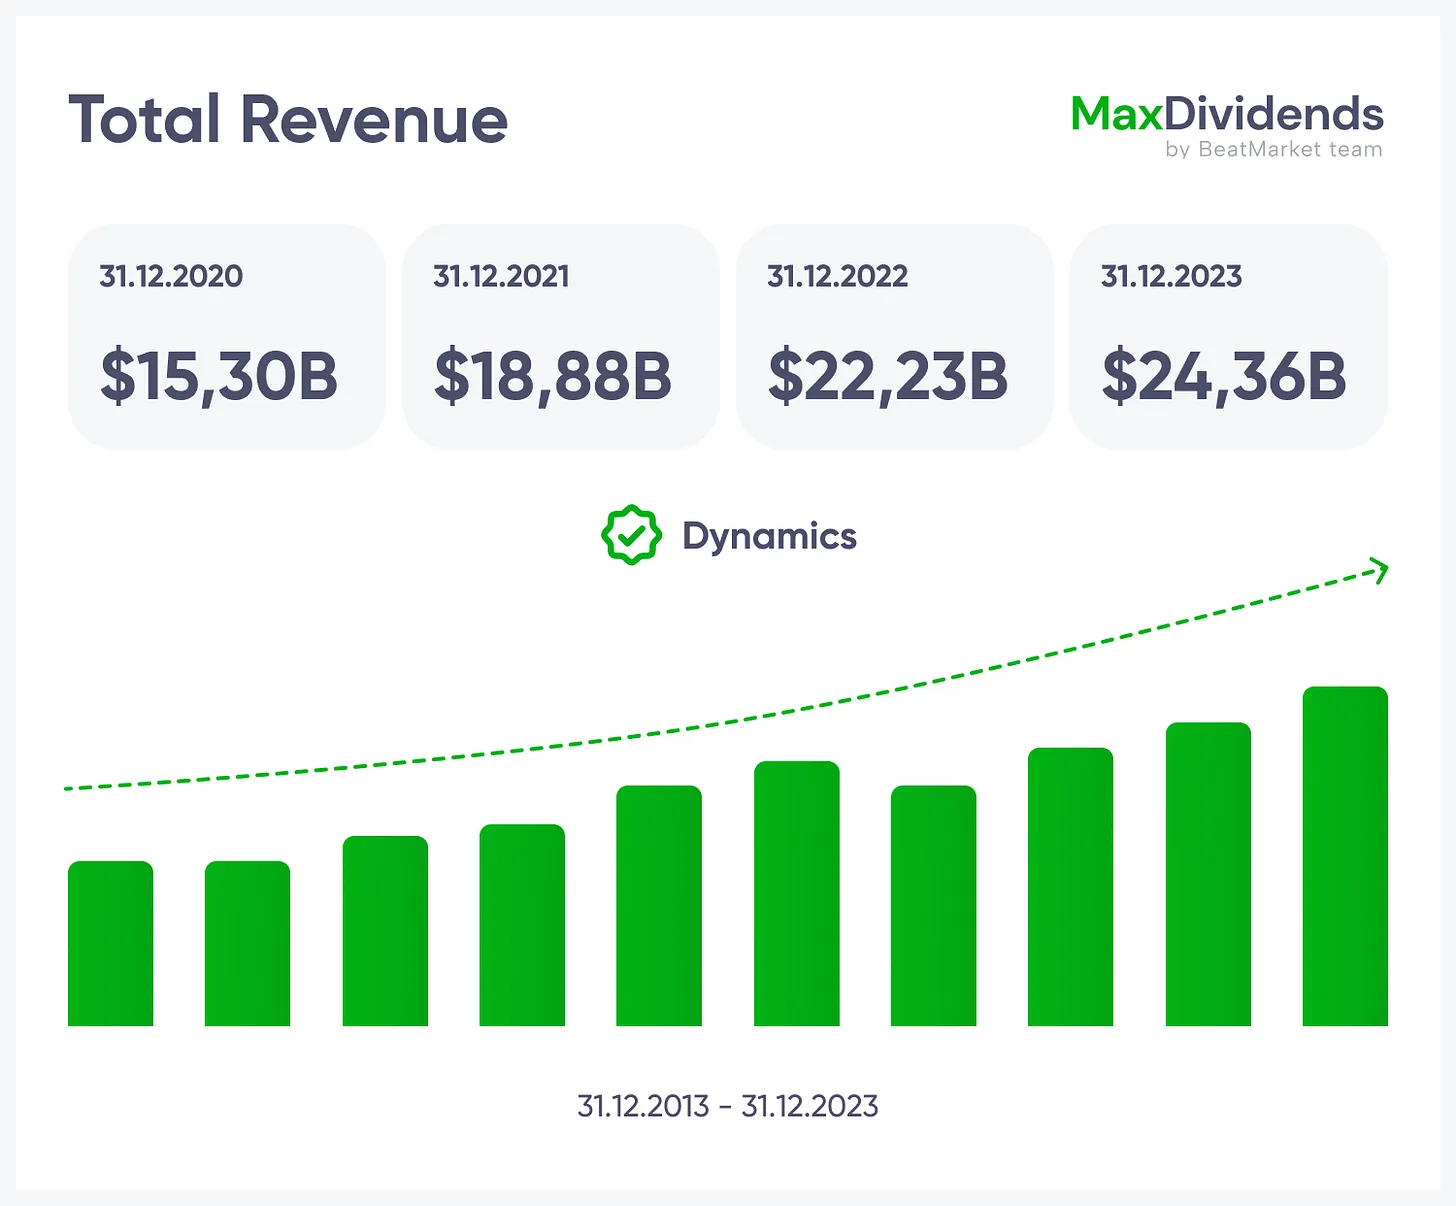




 See the whole business at a glance — what it does, how it earns, and the value it brings.

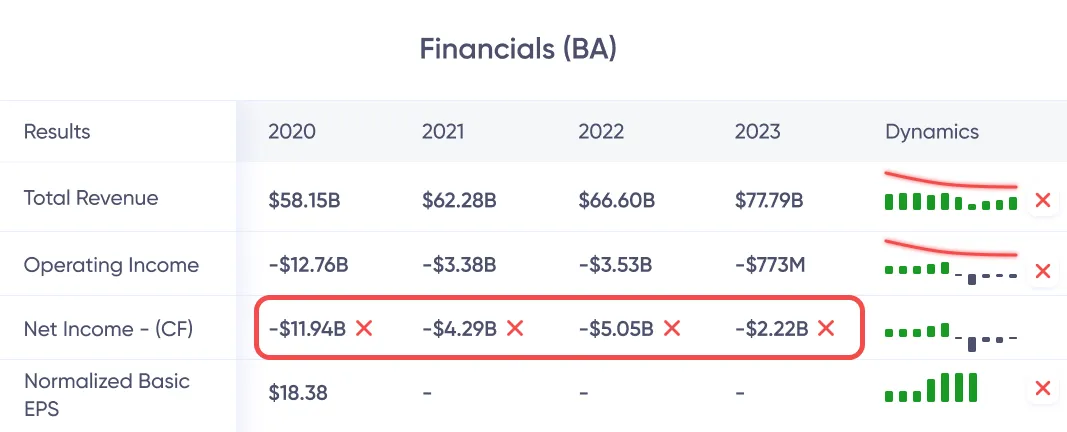
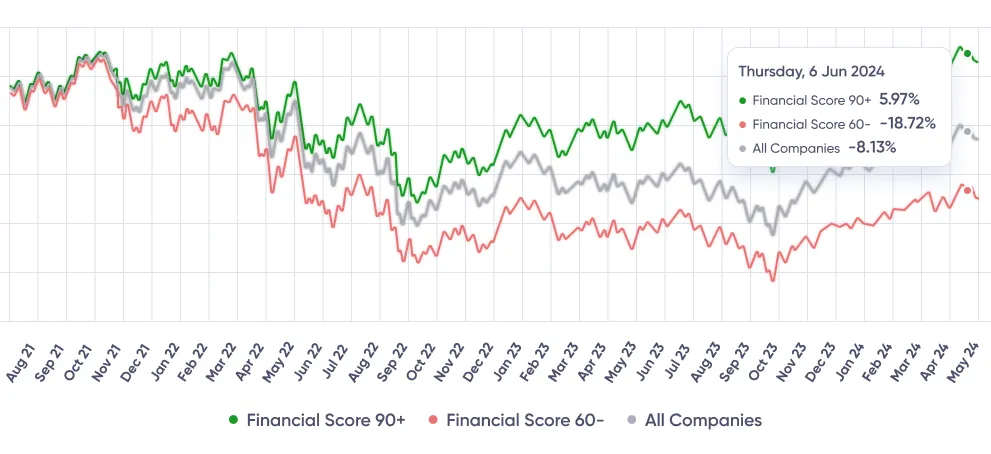
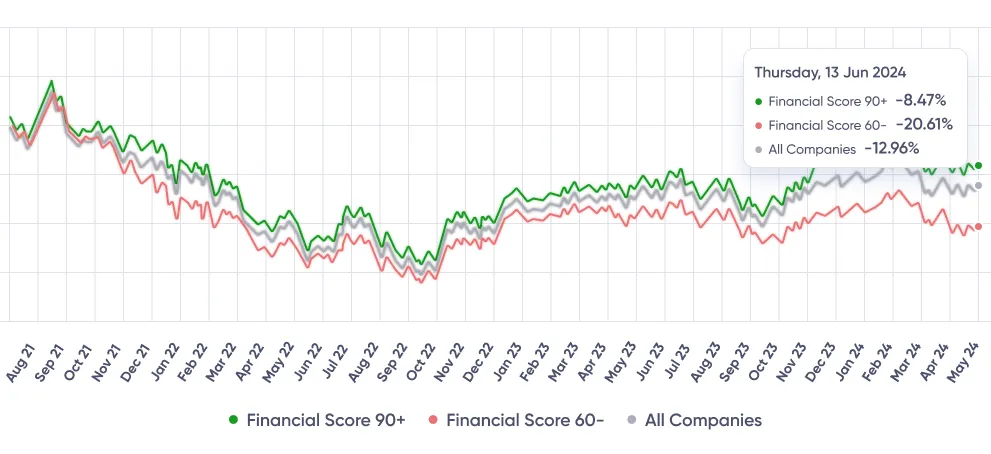
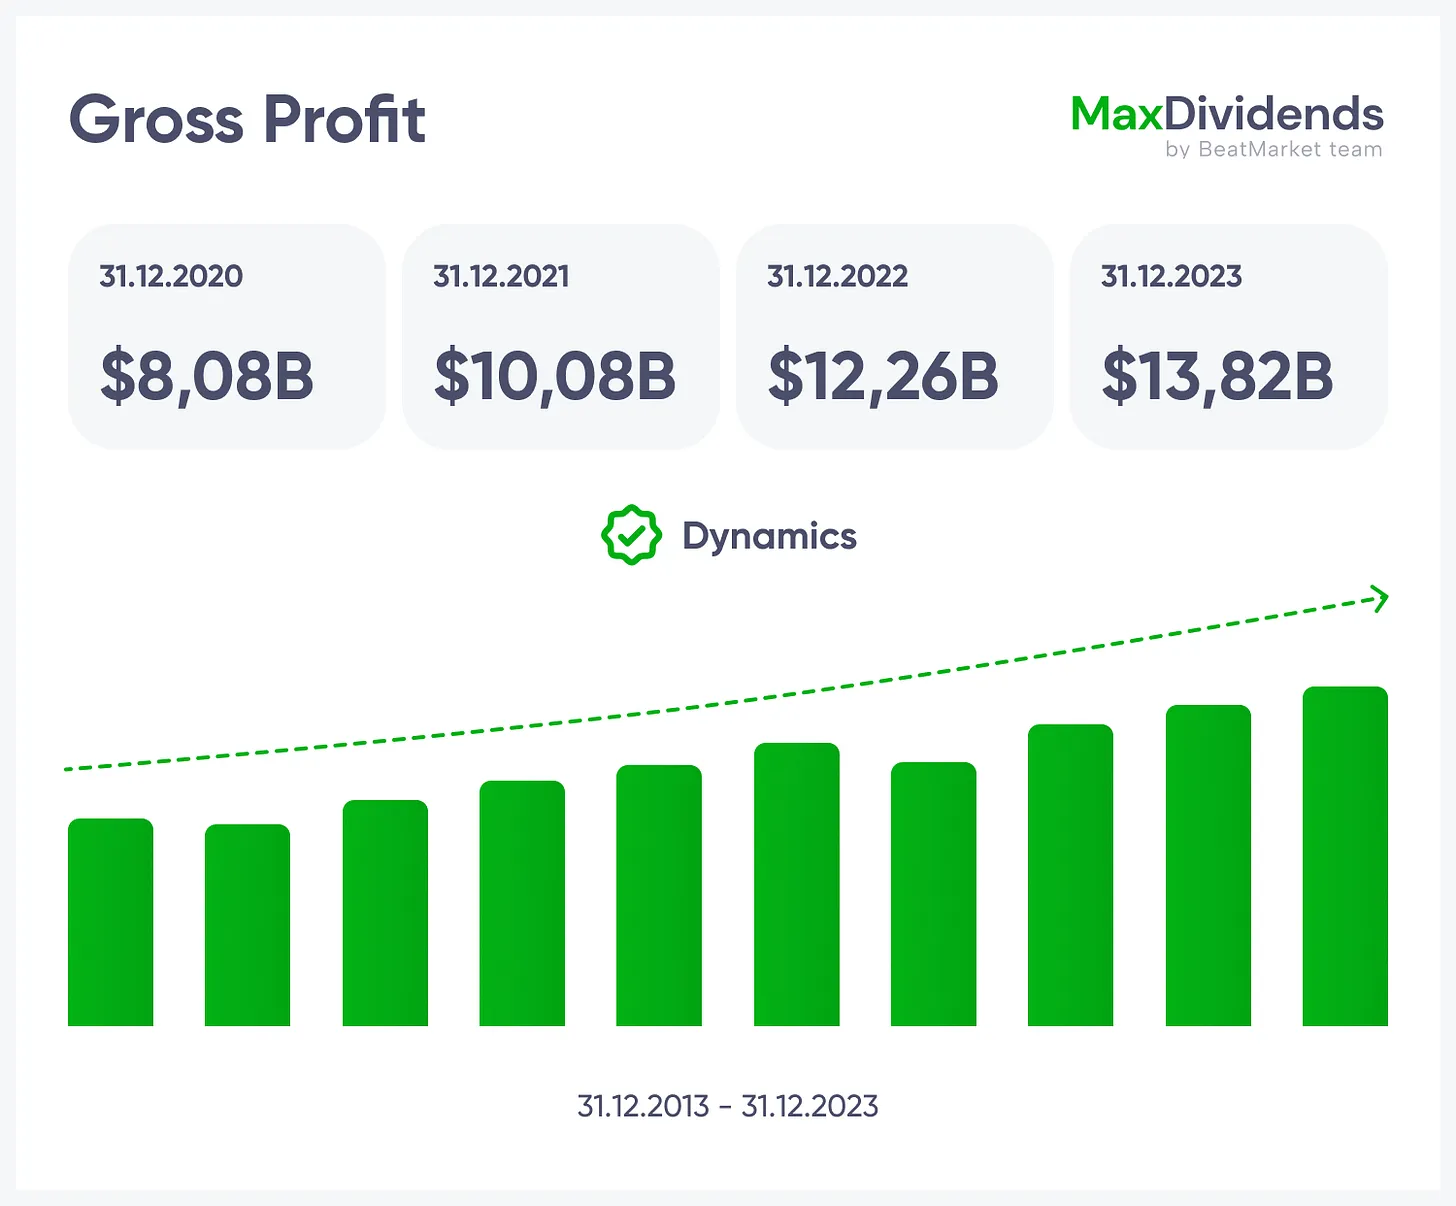
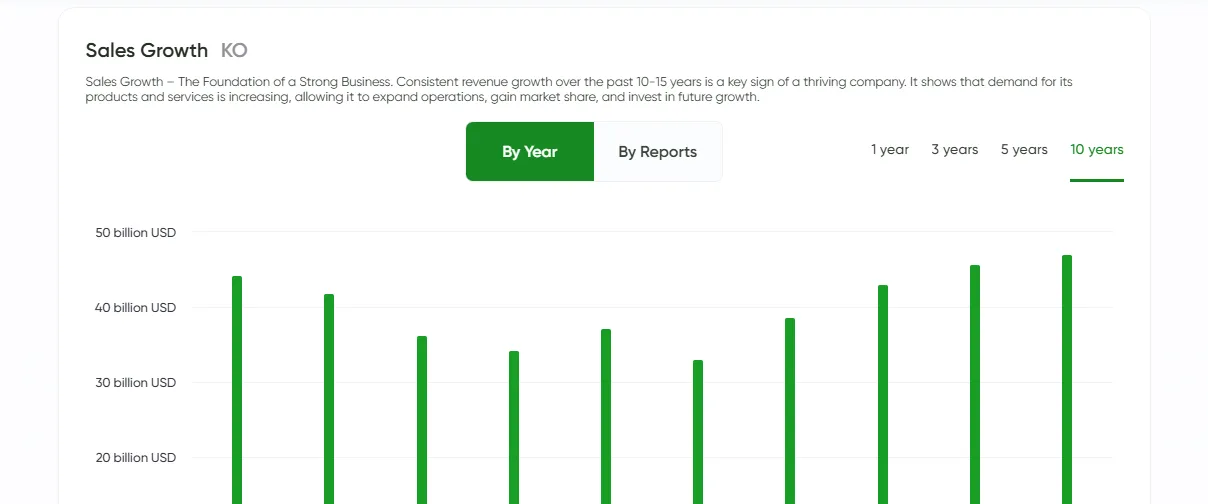 Growth trend, clear in one glance.
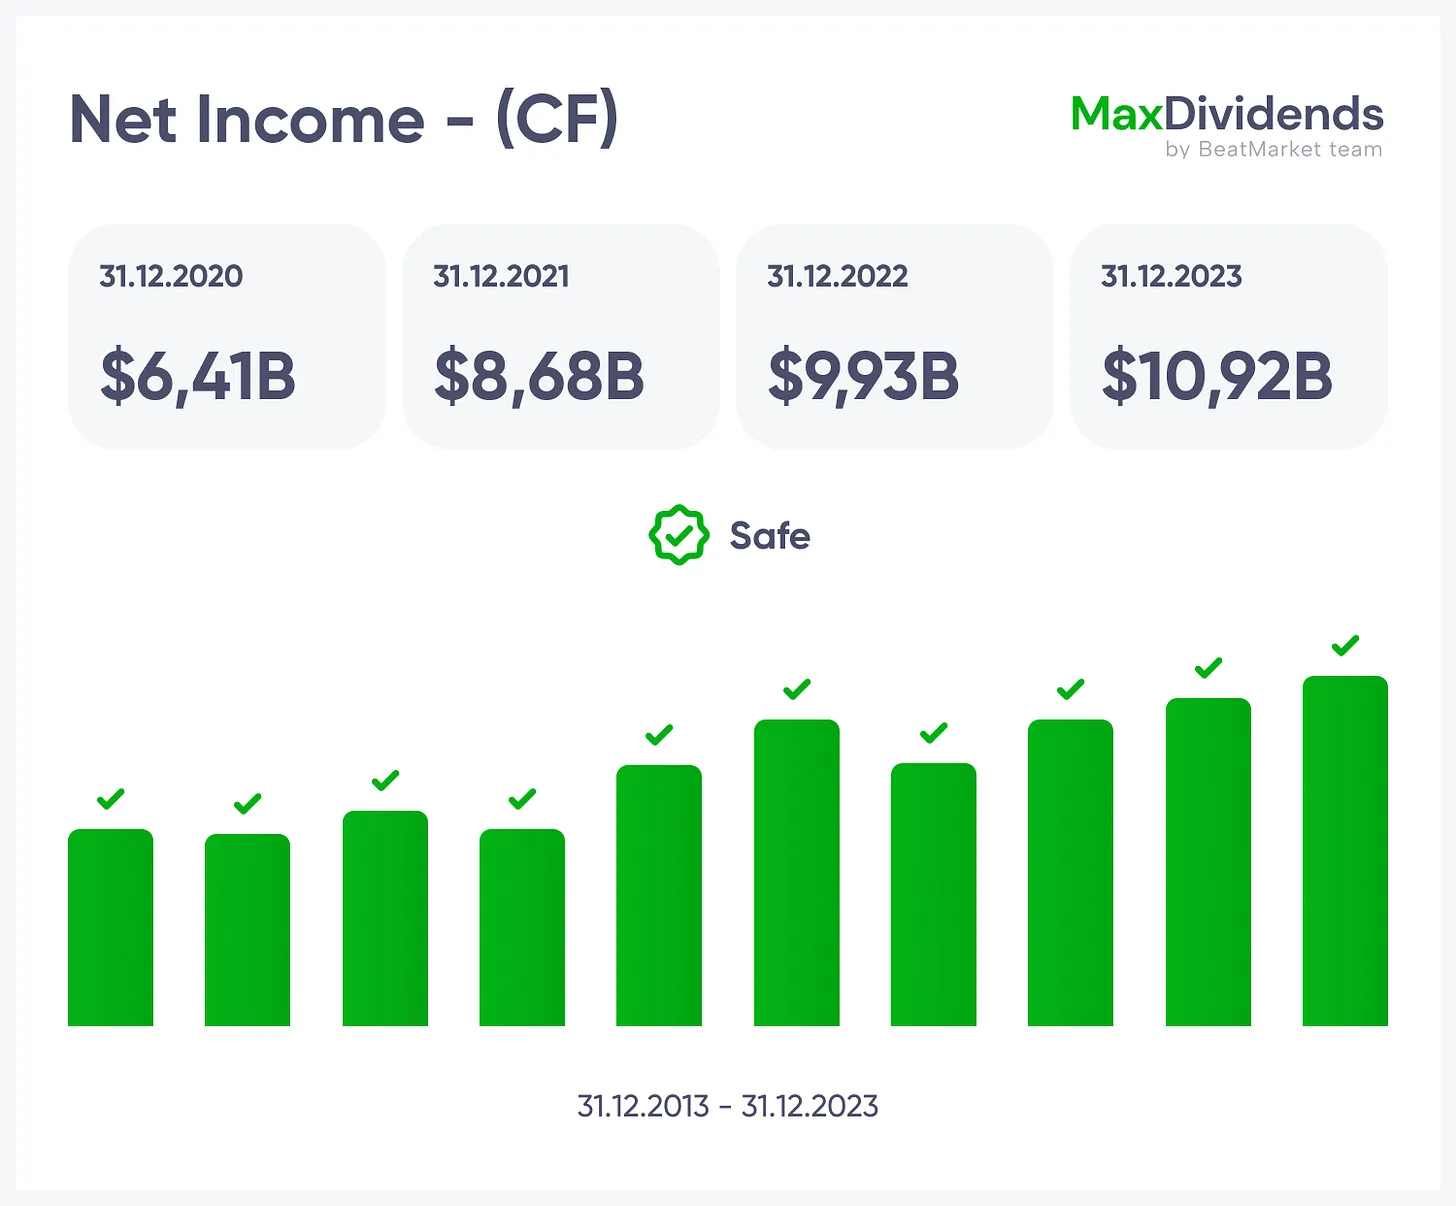
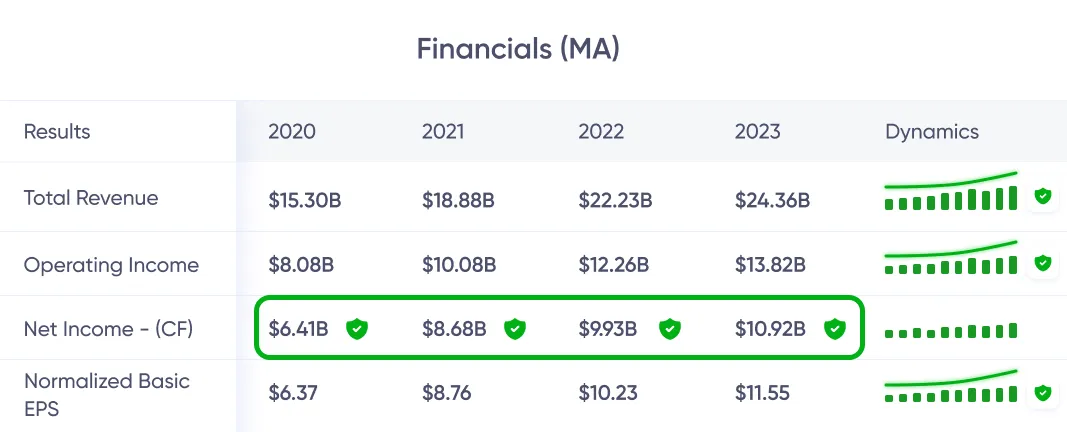
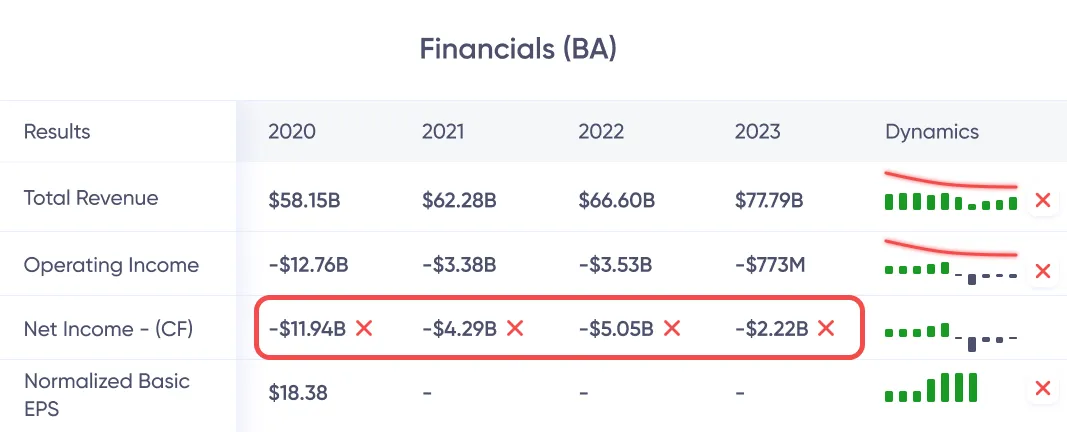
 See if profits are real — instantly.
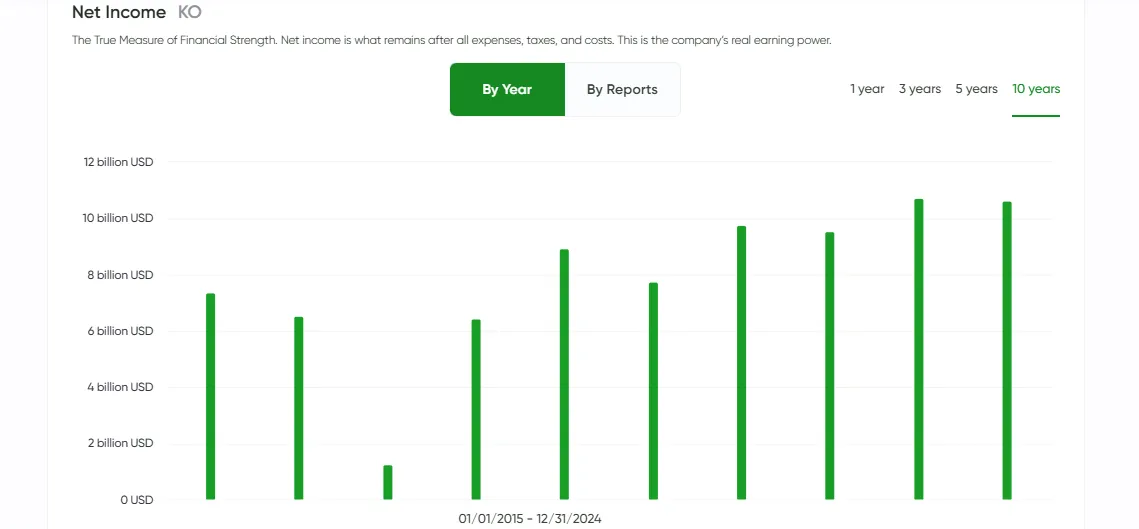 Bottom line made simple with MaxDividends.
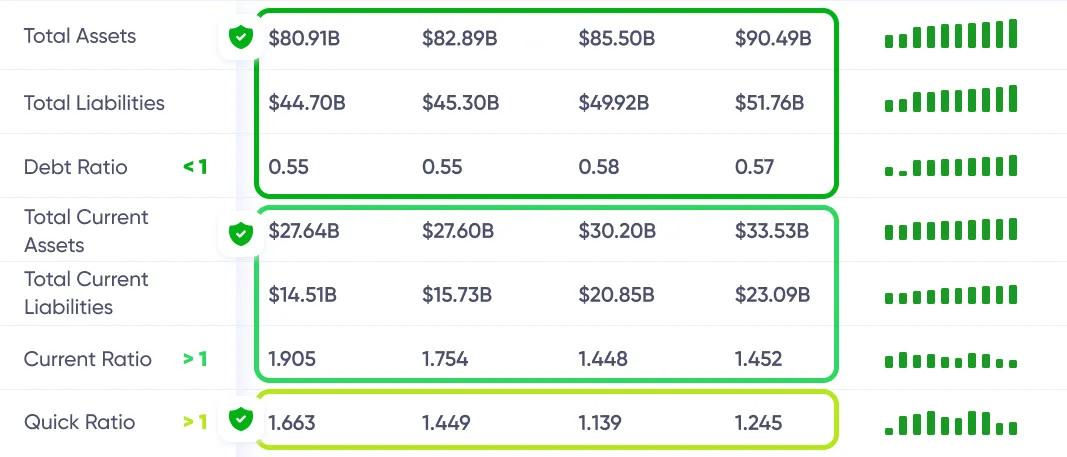
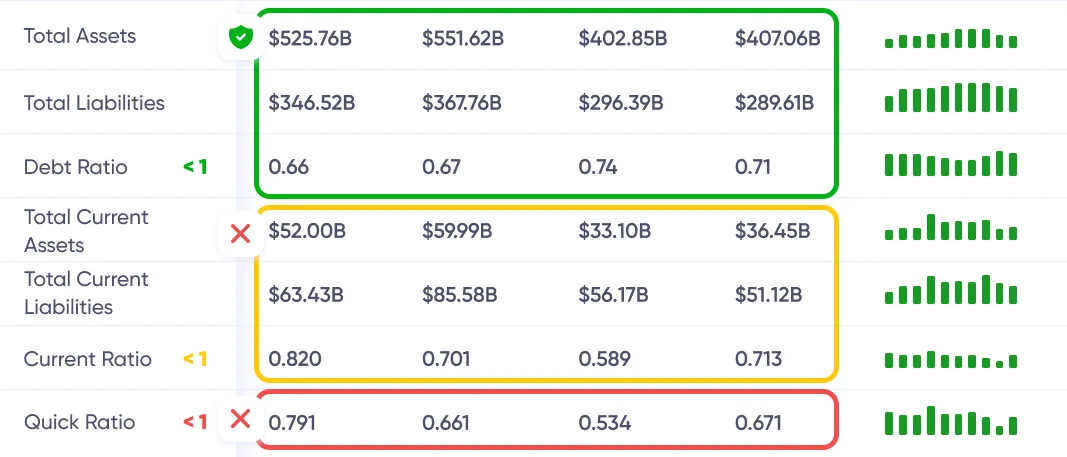
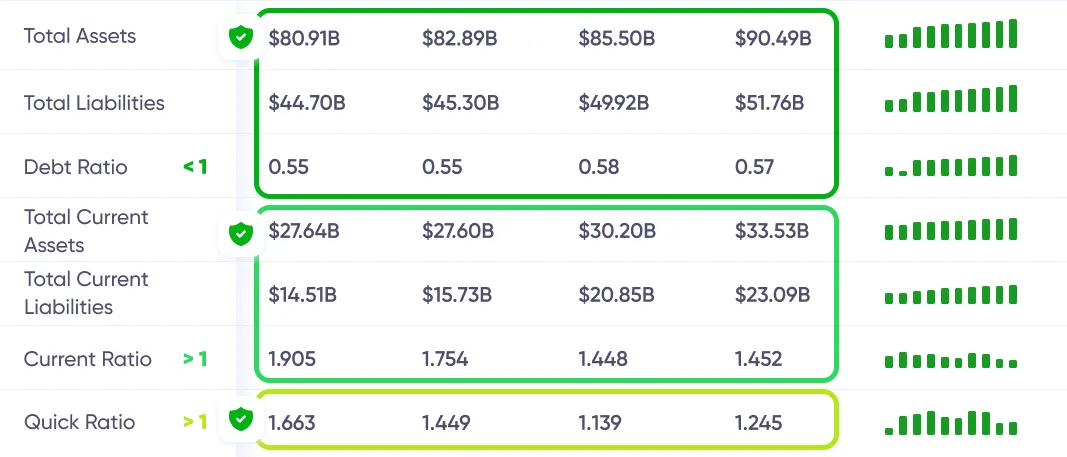
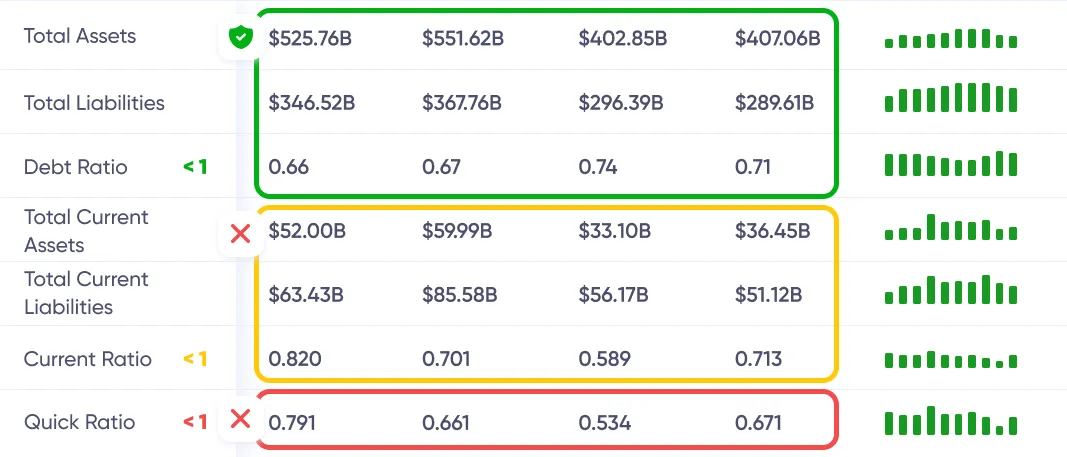
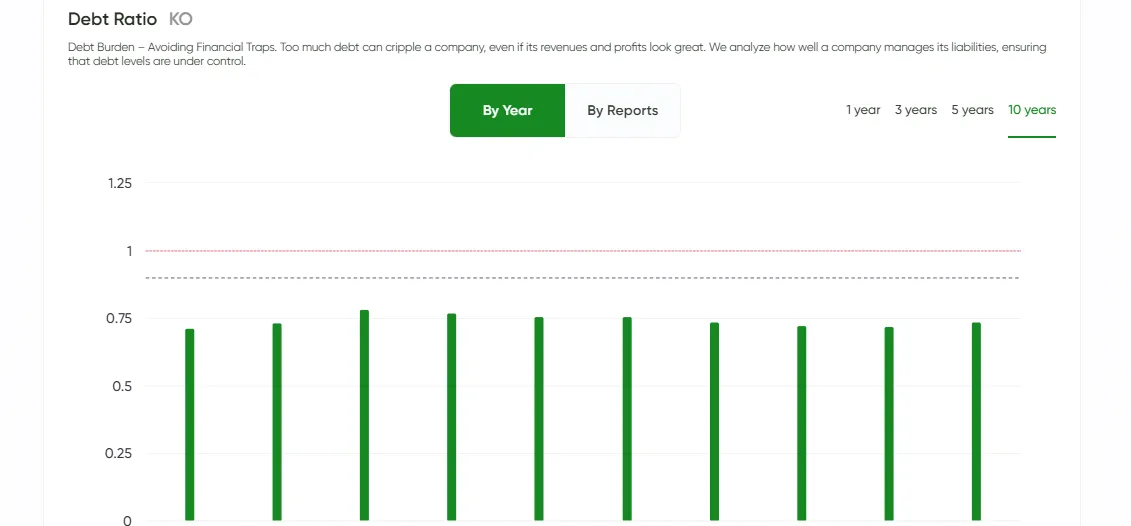 Debt risk checked for you, 24/7.
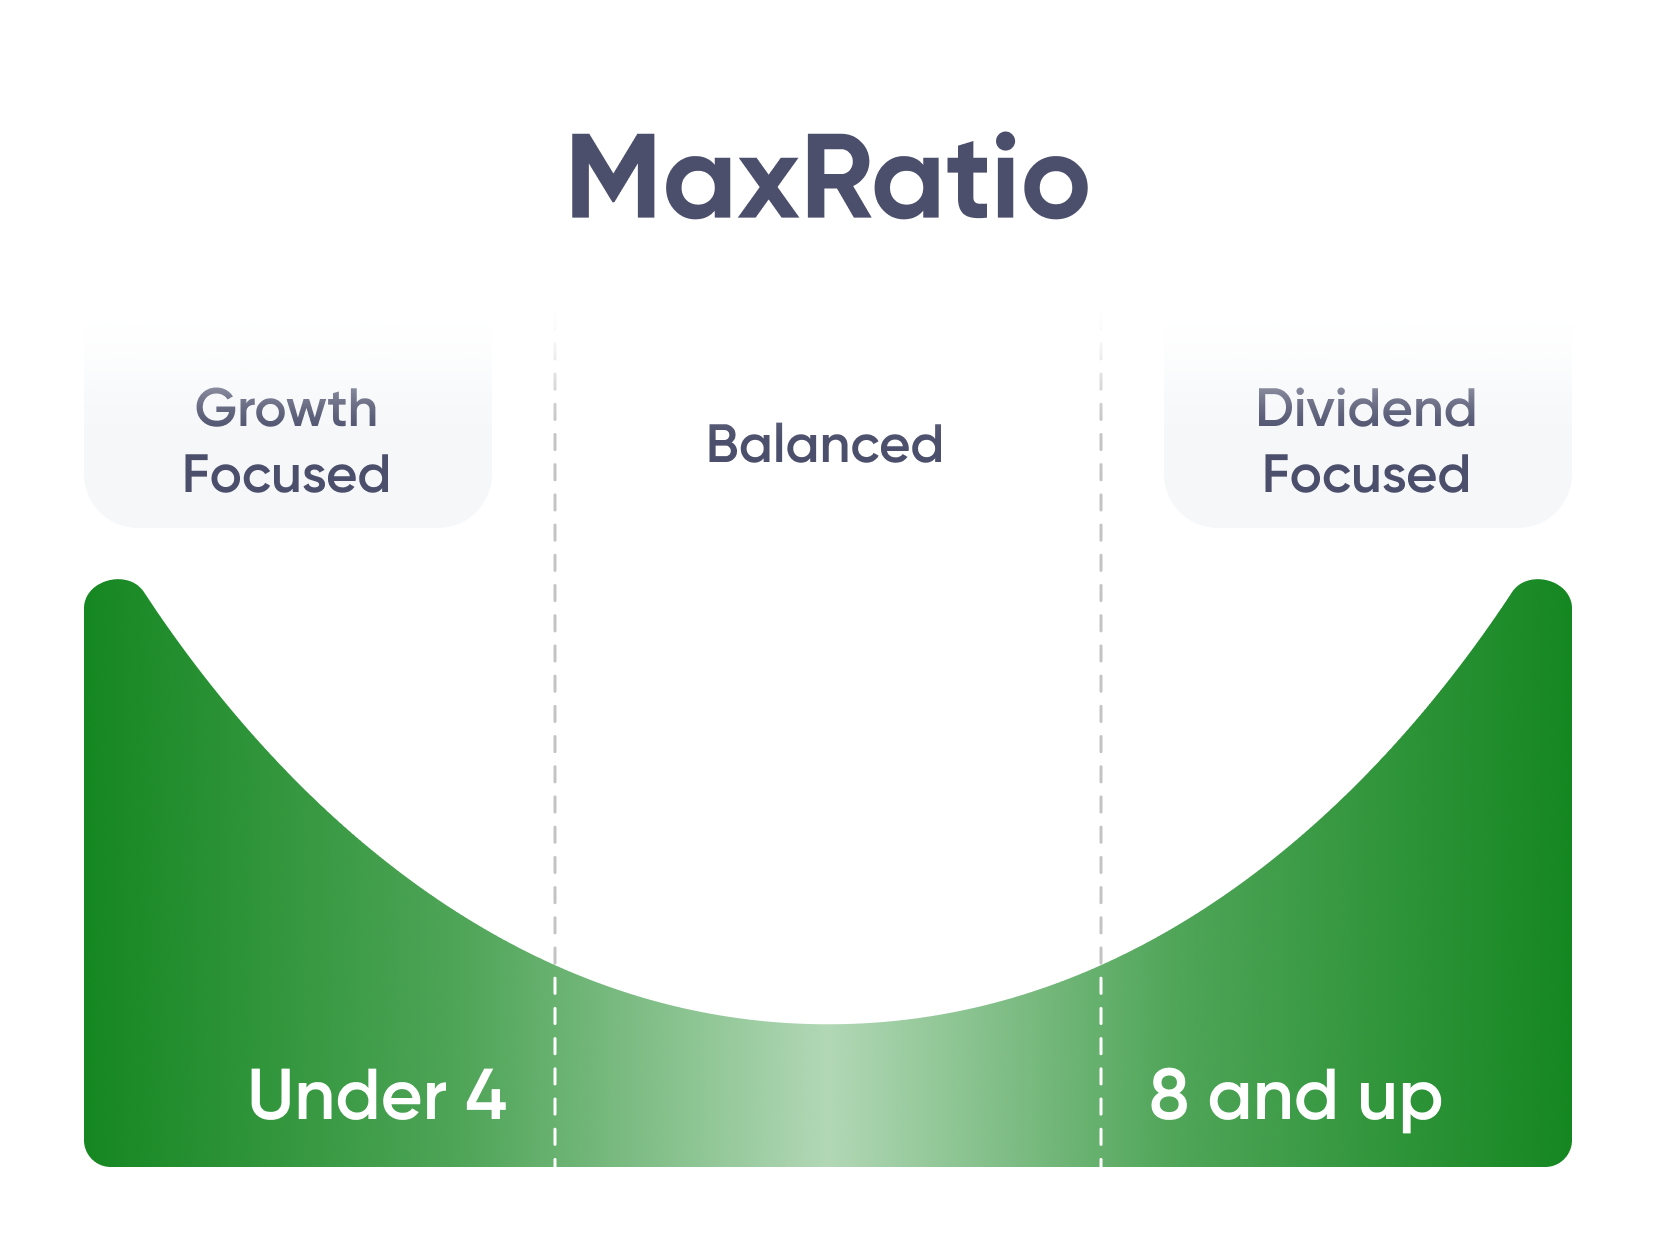
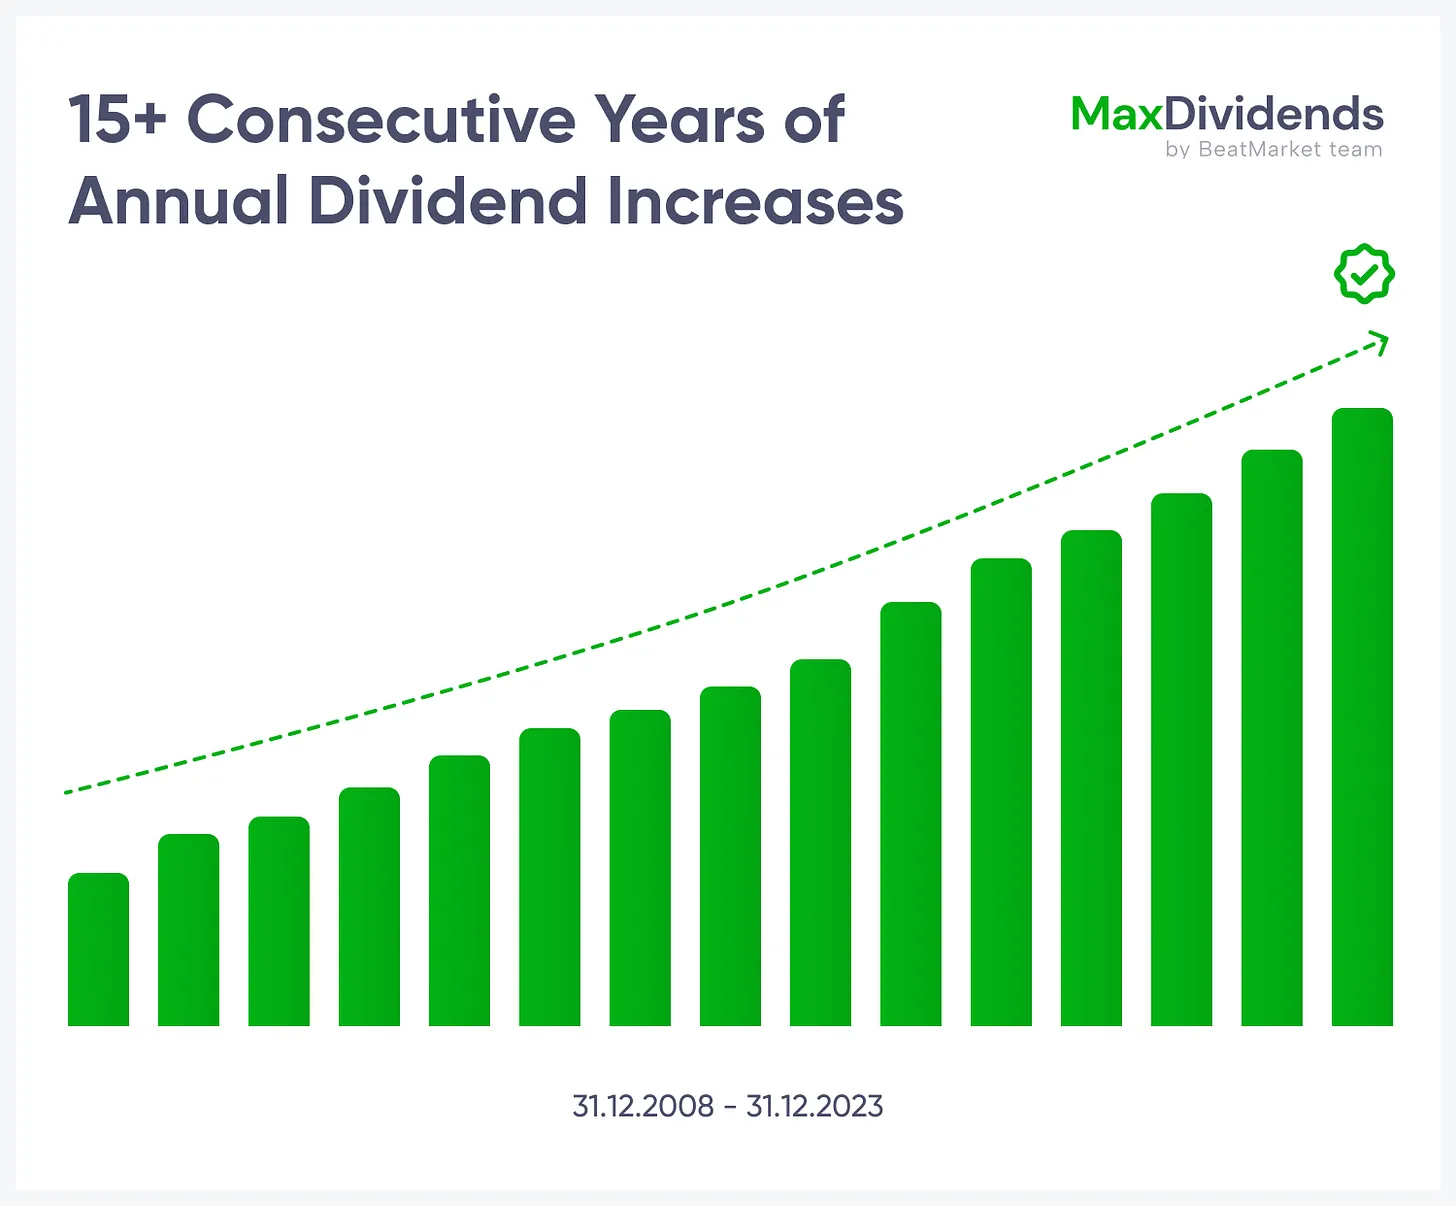
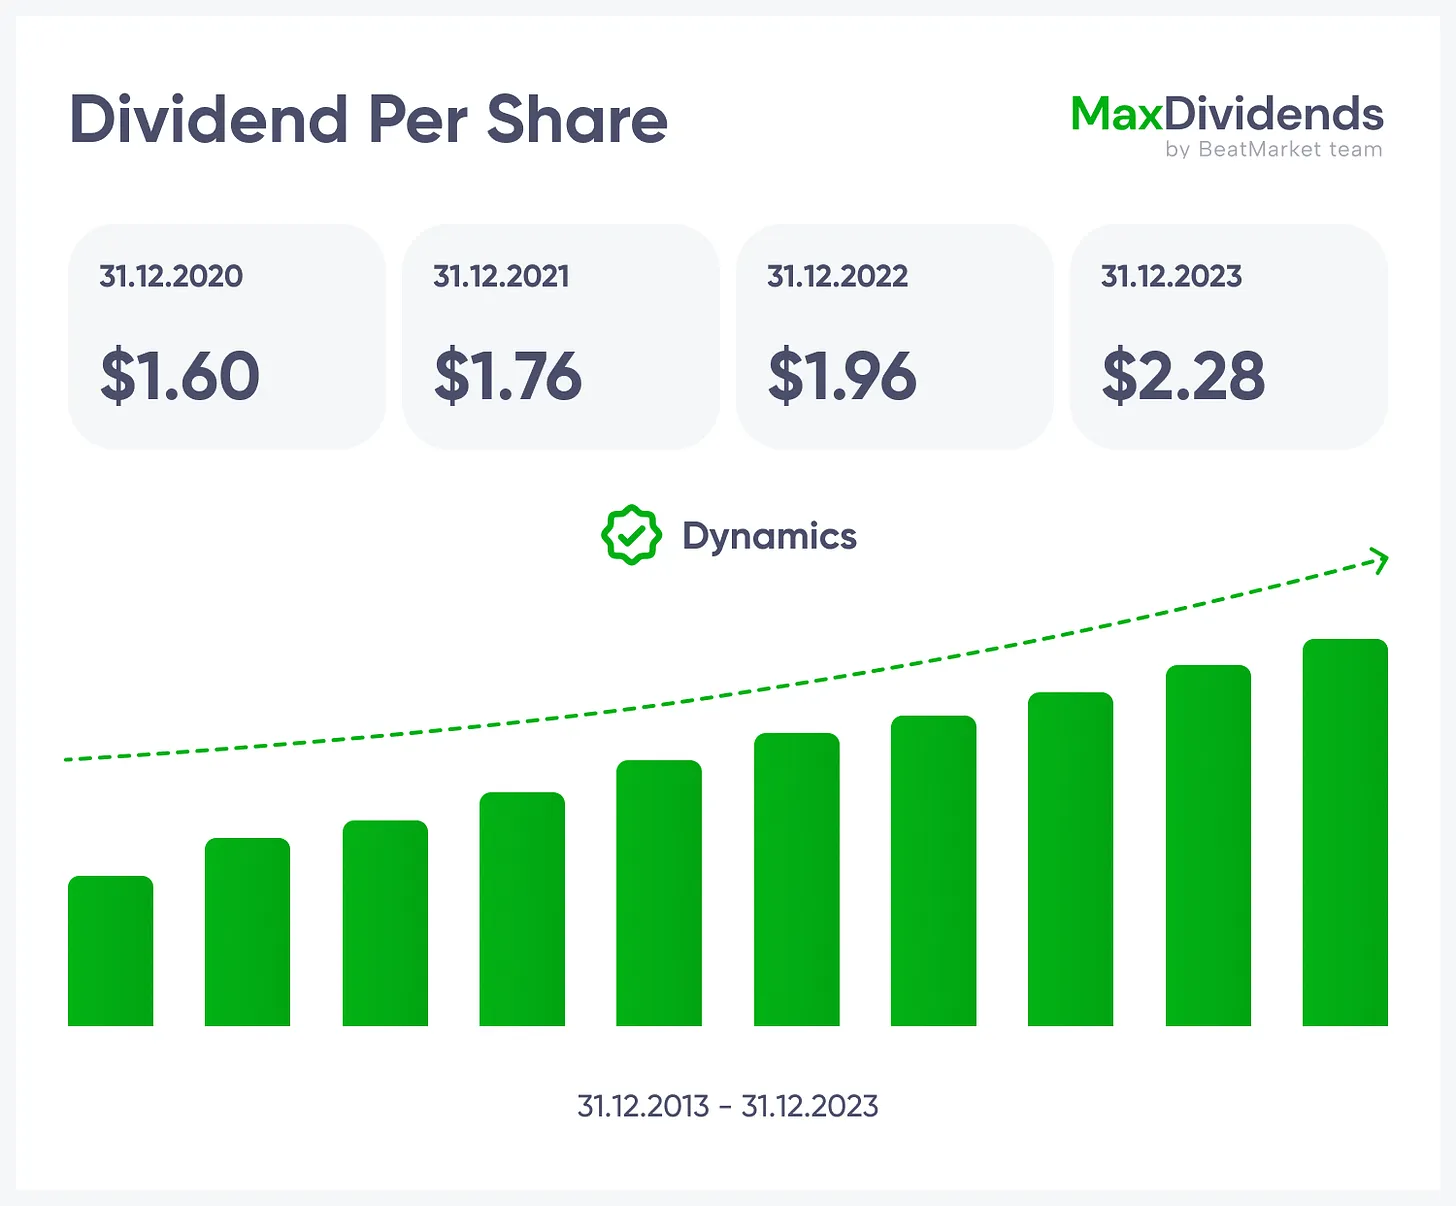
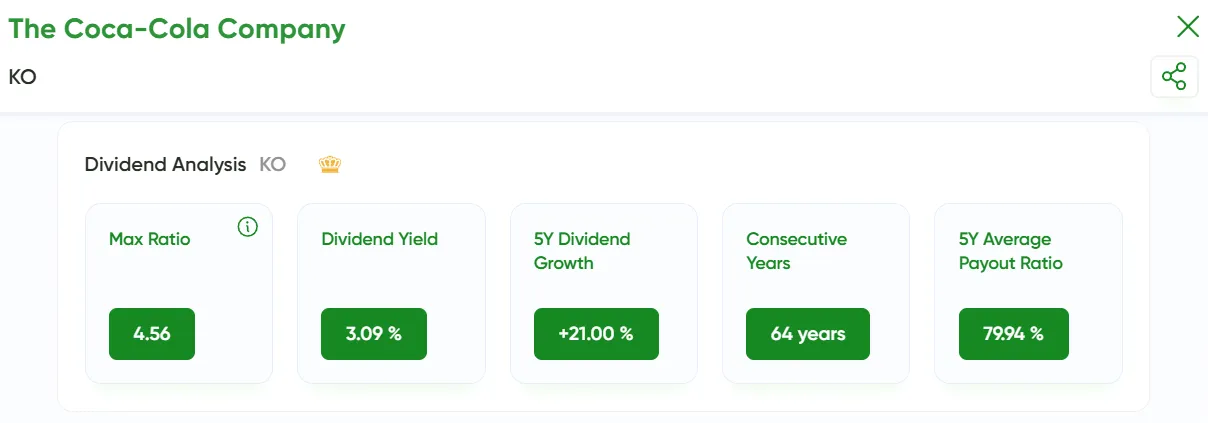
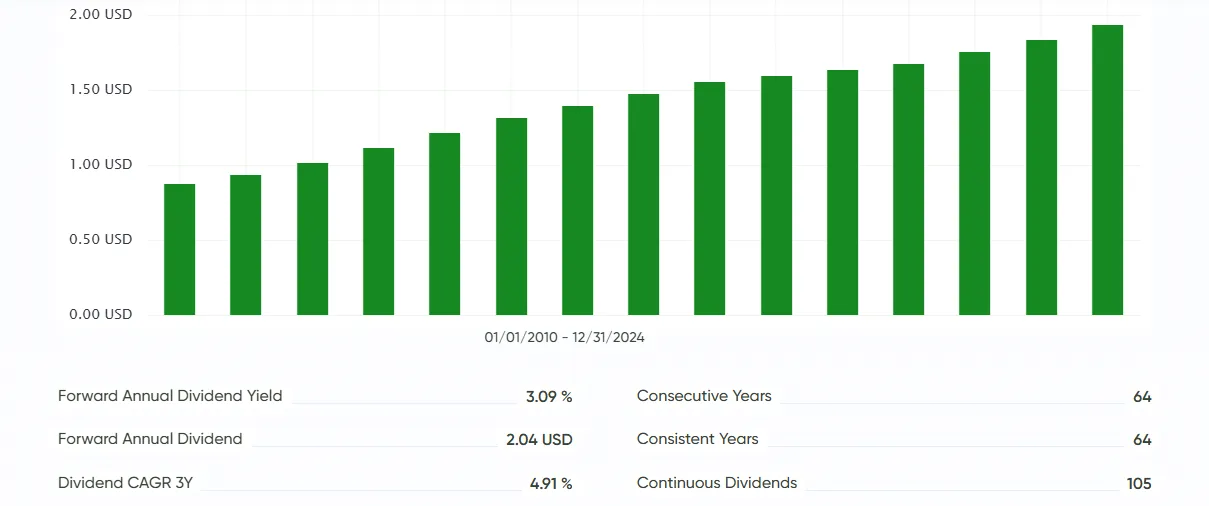
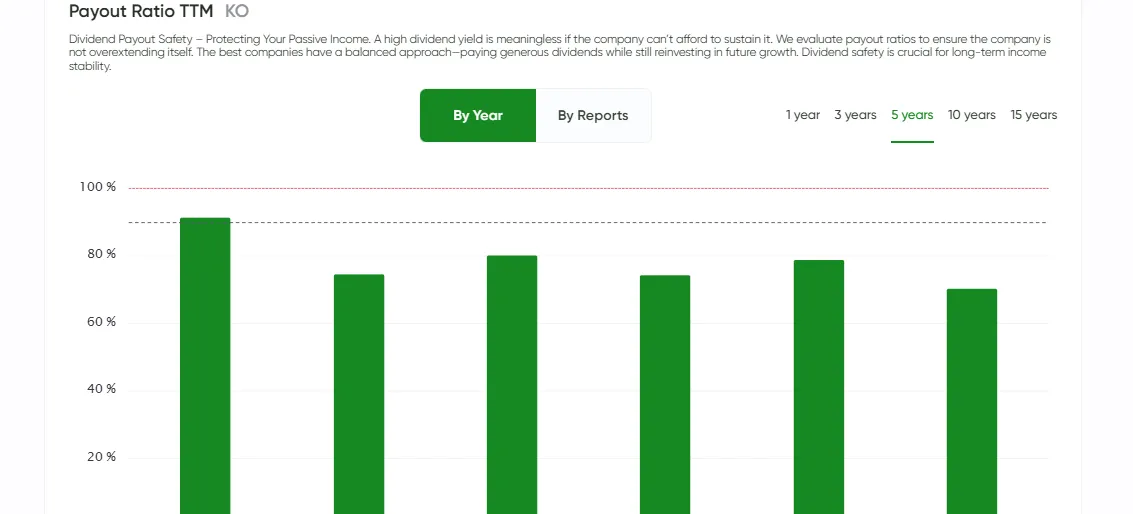 Dividend streaks and raises at your fingertips.
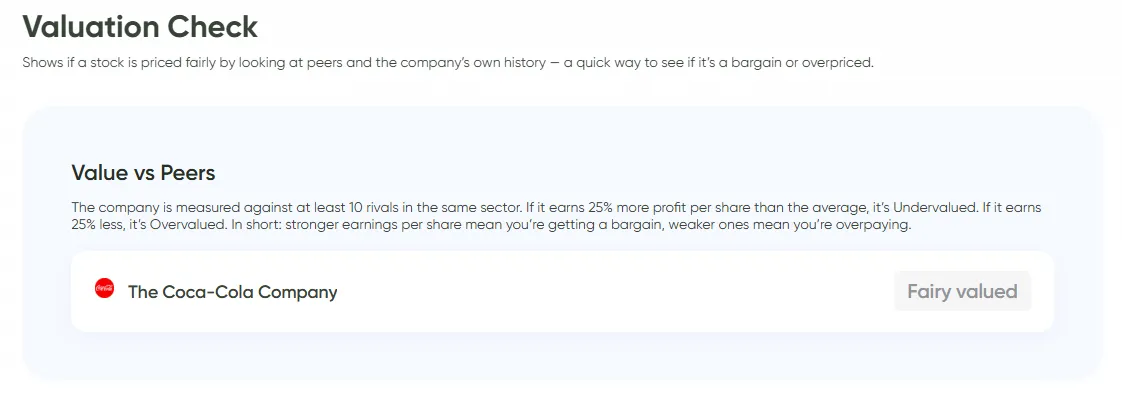 Stack the company against rivals. If it earns more per share, it's undervalued. If less, overpriced.
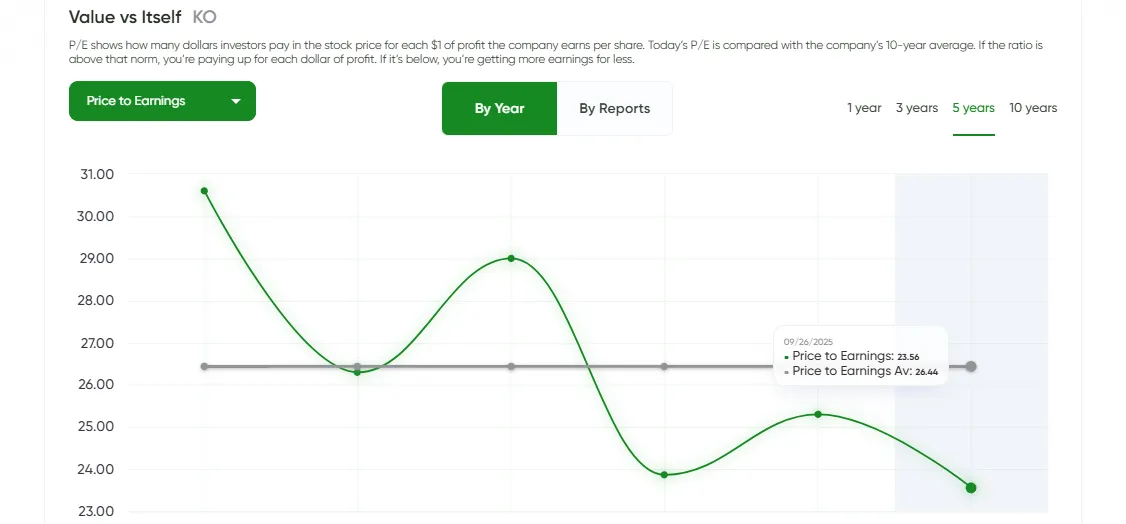 Compare today's P/E with its own 10-year history. Above average = expensive. Below = bargain.
 See if the stock trades below its assets. That's buying the business with built-in margin of safety.

 BeatStart